The story behind your presentation

Just a quick one…

The beginning of this HBR article, How to give a killer presentation, is intriguing to the relationship of what many of us just experienced in our final presentations of MP.  Even though this article is shortened to non-subscribers, the intriguing part to me is the basis of the article – a story about a boy who had a story to tell.  The 90+ of us just finished our presentations, and it was amazing to see what some of my peers had to say.  Learning from each other is one of the biggest facets of this program, yet at the same time this isn’t just to learn about each others’ business knowledge, but to learn about the more personal part of each others’ lives.

Many of us gave great presentations, and as this article began, you have to begin with a good background to your story.  I think the key to this article is not just another subset of bulletpoints of how to do a process (although that’s probably where the article heads), but to make you think about what the baseline of any presentation needs to be – a good story.  A lot of times we can get caught up in the details – get caught up in the data.  Presenting the data is so critical, that we forget what the baseline is, and how to bring the story completely together, full circle.  Without a clearly stated statement at the beginning of your presentation, there’s a good chance you’ve already lost a large part of the story you’re trying to tell.

http://hbr.org/2013/06/how-to-give-a-killer-presentation/ar/1
Tell Your Digital Story (or someone will do it for you)

The value of a story is timeless, but the medium in which stories are disseminated has changed dramatically in just the last decade.  Tom Cochran, chief technology officer at Atlantic Media, said, “If you don’t have a digital presence today, you don’t exist.” The fastest way to influence a group of followers is through a digital story, whether it be through a short tweet or through a well-crafted blog post.  And the thing is, even if you don’t create a digital presence for yourself or your company, someone else will do it for you.

The advice given by Word of Mouth Marketing author Andy Sernovitz is to embrace digital and join the conversation.   It’s more important to be responsive than to be right.  Below are four digital recommendations offered by Sernovitz:

  1. Build credibility before you need it: Build a community that knows you and knows your brand.  If any negative PR does occur, you’ll already have a support team of fans and a platform in which to respond.
  2. Bring it inside the tent:  You are better off if criticism happens on your own blog or website because you will be able respond more quickly and contrast the negative comment with positive comments from all of your other fans.  Do not remove criticism, but use your forum to respond in a helpful and caring way.
  3. Let your fans do it:  If possible, have your fans respond to negative comments.  A defense from a fan is more valuable than a defense from within the company.
  4. Never get caught by surprise: Stay plugged in to what your fans are saying and respond immediately.  Conversations move quickly in the digital world.  If you want to have an influence, participate in the moment.

A Dell customer service disaster gone viral via social media by Jeff Jervis in 2005 points succinctly to the power of the internet, the influence of customers, and the customer’s expectation of engagement and response.  Dell had a hard lesson to learn about the power of the consumer voice in digital media, but in the end, they have strengthened their relationships with their customers and created a forum in which customers can interact.

You have a choice, an opportunity, to participate in digital platforms.  Join conversations, offer helpful insights, maybe even defend and rectify every once in a while.  What do you have to lose?  The only way that you will find out what people are saying and what people are waiting for you to say is by engaging in the digital story.

How Effective Leaders Solve Problems

Effective leaders tend to find a strong balance between data analysis and intuition. Many times, the aspect of intuition comes from recognizing patterns or trends. A big part of problem solving is recognizing these trends and finding ways to minimize its reoccurrence. Additionally, it is important for leaders to understand the true essence of the problem rather than finding a temporary fix that will likely rise again in the near future. This gives leaders more time to focus on other areas of the business rather than continuing to fix the same problem over and over again.

Understanding the intricacies of every aspect of the business is one way to develop a strong sense of how your decisions can affect specific areas of the business. Effective leaders don’t look at problems as a nuisance; effective leaders see problems as an opportunity for ongoing improvements.

Forbes has come up with four characteristics that make an effective leader:

1) Transparent Communication: The main takeaway is that transparent communication allows for other people to be heard. It fosters an environment where people are willing to speak up if there is an issue.

2) Break Down Silos: The importance of this characteristic is to eliminate boundaries. It is important to solve problems that affect the overall business rather than one segment of the business.

3) Open-Minded People: Effective leaders are ones who are not discouraged to find innovative ways to solve a problem. They are individuals that do not avoid the problem; they are not afraid to face problems head-on.

4) A Solid Foundational Strategy: As we have learned in our Strategy course, a business without a strategy is dangerous. Effective leaders go beyond figuring out the problem; they find ways to implement a strategy to solve the problem. This includes resource allocation and budgeting.

Some final takeaways are:

  • Always step back and assess the situation; never take a blind guess when solving a problem.
  • Find ways to solve the cause of the problem to eliminate it from reoccurring.
  • Learn from your previous failures and use those lessons learned to solve future problems.
  • Don’t avoid problem solving; challenge yourself to solve the problem head-on.

To read more about becoming an effective leader, feel free to visit the article: http://www.forbes.com/sites/glennllopis/2013/11/04/the-4-most-effective-ways-leaders-solve-problems/.

Misleading Graphs & Statistical Lies

Graphs and Charts are everywhere, and are excellent tools to visually convey statistics, results, trends, data, etc. There are basically three groups of graphs out there that you’ll find on a regular basis:

1.) Graphs created by people who do know what they are doing

2.) Graphs created by people who don’t know what they are doing

3.) Graphs created by people who do know what they are doing and have manipulated it to intentionally deceive the viewer.

There’s a fine line between number 2 and 3 sometimes, and to be effective business leaders, one skill we must possess is the ability to call “BS”, whether intentional or unintentional. Below is a great book to help uncover a lot of deceptive tricks and a few some examples.

A great book that I highly recommend is: “How To Lie With Statistics“. It’s short, cheap, and uncovers numerous tricks people use with charts, graphs, numbers, and statistics to deceive the reader without breaking the rules.

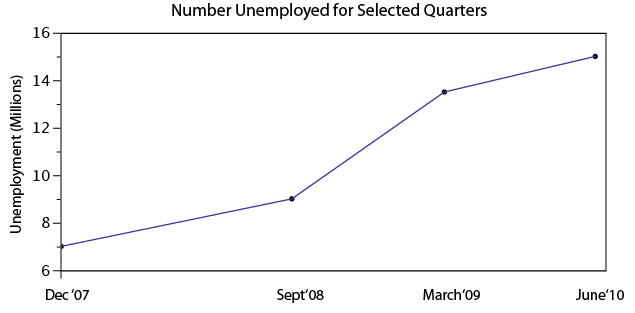
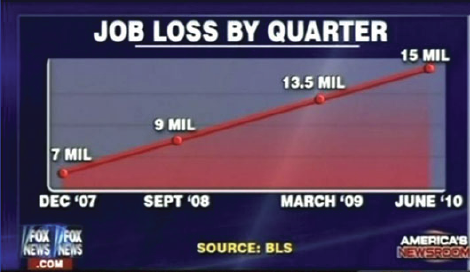
Not to pick on Fox News, but below is a graph that is severely misleading in both the title and the scale of the X-axis. The title leads you to believe the data is by consecutive quarter, and the inaccurate spacing on the X-axis leads to to believe the data is linear.

If you title and plot this data accurately, below is what you would get:

There are many types of errors or tricks that results in the display of data in an inaccurate way. Below are several categories and things to watch out for the next time somebody slaps a fancy looking report down on your desk:

USE OF THE 3D CHART:

Simple use of 3D charts distort the ratio of pies and the height of bars. Notice how Item A and C look more similar in the 3D chart, but flattened, C is less than half of A

ChartMisleading Pie Chart.pngSample Pie Chart.png

 IMPROPER SCALING:

Notice how the intent is to increase the value 3X (Y-Axis), while the perception is that it increased 9X

Improperly scaled picture graph.svg

Comparison of properly and improperly scaled picture graph.svg

The appropriate way to display the increase from 1 to 3 is shown below.

Picture Graph.svg

MISLEADING TRUNCATION:

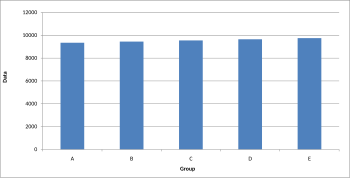
The truncation on the following graph leads the viewer to believe that group E is nearly twice the size of group A. While sometimes truncation is a great tool in certain situations, it is often misused.

Truncated Bar Graph.svg

Looking at the scale from 0 to 12,000 puts in perspective how slight of a difference there is between groups.

Bar graph.svg

IMPROPER AXIS RANGES:

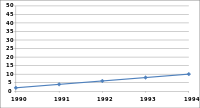
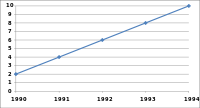
The graph immediately below makes you feel as though the growth over time has been slow and gradual, but a quick change of the axis values gives a completely different perception. Don’t always believe the slopes of lines as they are a function of the Axis values.

Line graph2.svg

Line graph3.svg

OMISSION OF SCALE:

When Scales are left off, the range of the axis is unknown and differences are easily exaggerated or minimized.

Bar graph missing zero1.svg    Example truncated bar graph.svg


“Always demand what is right, never accept second best.”

A little over three years ago I was watching the evening news. Towards the end the broadcast there was a segment to remember the life of a lifelong television producer, Mr. Jeff Gralnick, who had recently passed away. At the conclusion of Mr. Gralnick’s successful life story, the Anchor mentioned quote from him, “Always demand what is right, never accept second best.”

These words have stuck with me since and have been used as one of my own personal motto’s and guiding principles. They don’t mean that one needs to always have the “best of something,” but to strive for what is the most appropriate in a given situation.

As we continue to progress throughout our careers and develop into leaders, these are great words to operate with each day. I’ve used this philosophy when working with teams to ensure that tasks are not only completed successfully, but carried out in the correct manner, and have seen great results.

http://www.nbcnews.com/video/nightly-news/42981261

What do you think of this quote?

WJEM

Why We Don’t Speak Up at Work

Why do so many people choose not to speak up at work? Interestingly, it’s not always because we fear retribution or other negative consequences. In fact, the biggest reason people do not speak to their managers concerning feedback or suggestions is that they feel nothing would change even if they did speak up. According to a survey from the Cornel University Survey Research Institute, respondents chose not to speak up to their managers because they think it is “a waste of time.” This feeling of futility can have far reaching effects on employees and the work environment as a whole.

The problem reminds me of the psychological theory of learned helplessness. Learned helplessness is the idea that depression and other negative mental states and illnesses “result from a perceived absence of control over the outcome of the situation.” Although the theory was originally studied in animals, it has applications in people too, particularly in the workplace. When employees feel like they have no control, they begin to feel helpless; and when they feel helpless or like all of their feedback ‘falls on deaf ears,’ why would they speak up at work?

So how do we fix this problem? Claire Lew, the CEO of Know Your Company, provides some suggestions:

  1. Treat people that do speak up with dignity and respect. Ensure that they know they are being heard.
  2. Explain why you are not doing something. If there’s no explanation for not following their suggestions, employees will assume that the new ideas brought to the table are simply being ignored.
  3. Act on your employees’ suggestions. Claire states that the best way to encourage employees to speak up more and create a positive workplace is to act on the feedback offered – no matter how small.

These changes are relatively small and very easy to implement, but they have a huge impact on the company culture and on the employees working there. The next hurdle might be actually getting managers to listen to feedback about feedback…

More Excel Resources

If you are like me and plan to continue developing your excel skills even more, this website has some great advanced excel tutorials. For each of the monthly tutorials, there are 6 or 7 advanced tutorials like COUNTIFS, Duplicate removal, or bubble charts.

http://isaacgottlieb.com/tip-of-the-month

I found these tutorials on a comprehensive website called skilledup.com that has a lot of different resources that are worth checking out.

http://www.skilledup.com/learn/business-entrepreneurship/free-excel-tutorials/

From the skilledup.com website, I also found Excel Central and Chandoo especially helpful. Excel Central has great basic through advanced video tutorials and Chandoo is super easy to navigate.

Enjoy these resources for your continued excel development. 🙂

Brandi

The Future of Business Intelligence…Literally!

Hopefully by now we’re all well versed in the forms of business intelligence that I discussed in my first article (peers, industry publications, and databases).  Now the question remains, what do we do with the information?  I recently read an article by Tom Groenfeldt, written for Forbes.  Here’s a quick link: http://www.forbes.com/sites/tomgroenfeldt/2014/07/30/business-intelligence-bi-isnt-very-intelligent-yet

Tom cleverly points out that “in a SunGard survey of executives in the two industries, only 20 percent use proactive and investigative techniques or showed an interest in scorecards, dashboards and analytics techniques.”  In short, this means that many executives and business analysts are using previously recorded data to formulate strategies and make decisions.  He goes on to say that “only 13% of respondents utilize advanced BI techniques such as predictive analytics and alerts.”  

While this may not be a surprise in for some of us, I would have expected a higher percentage of executives to use some form of predictive analytics, especially in high tech industries.  With this said, I feel like this is a good opportunity to be a part of what could be a movement in this direction.  Clearly there will be growth in this field, and it’s likely that more companies, in a wider set of industries, could employ these tools to develop strategies.  If we can acquire these skills (or at least be able to speak the language), we certainly put ourselves on the front end of a trend that will likely have staying power.

I had a meeting with a business intelligence officer at my company today, and I was very impressed with the tools we have at hand.  However, it does seem that our company is mostly focused on managing and interpreting the bulk data that we collect regularly.  Do any of you have experience with predictive analytics and alerts?  What has your experience been?

Some More Analysis Frameworks

In our first semester we learned about issue trees in MP and event trees in DDA and how they help break-down problem statements into solvable nuggets. In addition to these trees, here are three more analytical frameworks to breakdown problems:

  • Means-ends networks: The initial problem statement is broken down by identifying all the obstacles that hinder reaching the goal. Then develop an action to get past this obstacle and in turn identify new obstacles that would thwart this plan. When all of these levels’ impediments are addressed, the overall problem statement should be solved.1
  • Objective hierarchy: Another hierarchical structure where a broad objective is developed out of the problem statement at the highest level. This objective is broken down into narrower objectives. As the objectives get narrower they take the form of actions, therefore they are called ‘means objectives’.2

Consequence tables: This structure is useful in comparing multiple options. List the multiple alternatives on one axis of the table and attributes to compare on the other axis. Give each alternative a rating for each attribute (the rating being relative to that of the other alternatives). Color coding the ratings based on different thresholds visually helps in comparing the alternatives.3

Looking back at our past two MP project I feel as though a means-end network would have been very beneficial (in addition to the issue trees we developed). There were several obstacles in both the Carlos Museum and Delta projects that needed to be sorted out and solved at a basic level.

Sources:

  1. http://www.bcp.psych.ualberta.ca/~mike/Pearl_Street/Dictionary/contents/M/meansends.html
  2. http://www.fs.fed.us/psw/topics/fire_science/craft/craft/Four_stages/Objectives/Objectives_hierarchy_tutorial.htm
  3. http://www.structureddecisionmaking.org/steps/step4consequences/consequences2/

The Lion King: What we can learn from Simba’s story

In a recent article over at copyblogger.com by Sean D’Souza he takes us through the three critical components of great stories by telling drawing a parallel to a Disney classic.  In my rendition I’ll convert his story of Cinderalla to the Lion King…because that is my favorite, and this is my post.

1.  The Sequence:

We’ve got Simba who’s the heir of to the throne at Pride Rock that runs into trouble when he faces his Uncle Scar’s quest to make the throne his own.  Simba is manipulated by Scar into thinking he is responsible for the tragic death of his Father and King, Mufasa.

There’s a sequence of events that are critical to building the drama needed in a good story.

2. The Suspense:

Simba runs away to avoid facing his Father’s untimely death.  He learns a new way of life and makes some entertaining friends along the way.  Meanwhile things take a turn for the worse when Scar unleashes his accomplices – the hyena’s on the fertile grounds surrounding Pride Rock.

Will Simba ever head back to face his past?  Who is this Nala character and why do I like her so much?  Does Simba get the girl?  All suspense.

3.  The roller coaster:

Highs and lows allow you to show the contrast and let the audience dig into the fact that this story really is worthwhile.  It keeps them on the edge of their seats waiting for the resolution.

So why is this kind of story telling critical?  Two reasons:

1. Most writers are unable to capture the elements of the story.

According to D’Souza, “Even if they get the sequence right, they rarely build in the suspense or the roller coaster.  That’s because they aren’t aware of these elements, or just don’t know how to go about it.”

2.  Most articles are almost always how-to or reporter like.

Stories are just more interesting and will naturally pique the reader’s interest more than reports.

The classic stories, Disney or otherwise, constantly bring people back time and time again when they already know the ending.  Now you know why.  With a little bit of practice you can implement this three step approach.  Or at a minimum give some thought to why you love your favorite Disney cartoon so much.

MEMBA learning community, Fall 2016- Spring 2017