Tag Archives: PowerPoint

Alternatives to PowerPoint

PowerPoint Alternatives: Will PowerPoint Ever be Obsolete?

Will PowerPoint ever be replaced?  It has become commonly accepted in the business world that ‘PowerPoint’ is synonymous with ‘Presentation’. However, when is the last time that you (or me, or anyone for that matter) questioned the validity of that accepted standard, or even gave fleeting consideration to using a different presentation platform or software program?

So, that leads to the question of whether or not PowerPoint will ever become obsolete, outdated, or replaced by something newer and shinier. In researching thoughts on this topic by folks smarter than myself (such as Jeff Bezos, CEO of Amazon, in this article), I discovered a few things.

First of all, there are already many of alternatives to PowerPoint, and while they might not be household names, they can arguably match the functionality of PowerPoint, and perhaps even be more targeted towards your audience depending on the nature of the presentation. Some of the more popular alternatives to PowerPoint include Apple’s Keynote (which Steve Jobs popularized by using when rolling out new products), Google docs (free, ‘quick and dirty”), SlideRocket (great for folks in a sales environment), and perhaps most notably, Prezi (Intuitive, sophisticated, puts ‘slides in motion’, great for storytelling).

I am personally considering giving Prezi a try based on the positive reviews and feedback that I have read and would love to hear from anyone in our class who has tried the software first-hand. It does seem that one day PowerPoint might be replaced as the gold standard for delivering presentations, but that day is likely not going to come anytime soon, and we are likely better off improving our delivery method rather than changing the platform all-together.

So, what are your thoughts??


Articles for Reference:

http://www.forbes.com/sites/carminegallo/2012/09/07/jeff-bezos-and-the-end-of-powerpoint-as-we-know-it/

http://lifehacker.com/5888189/five-best-powerpoint-alternatives

http://www.customshow.com/best-powerpoint-alternatives-presentation-programs/

http://www.powtoon.com/blog/10-best-powerpoint-alternatives/


The story behind your presentation

Just a quick one…

The beginning of this HBR article, How to give a killer presentation, is intriguing to the relationship of what many of us just experienced in our final presentations of MP.  Even though this article is shortened to non-subscribers, the intriguing part to me is the basis of the article – a story about a boy who had a story to tell.  The 90+ of us just finished our presentations, and it was amazing to see what some of my peers had to say.  Learning from each other is one of the biggest facets of this program, yet at the same time this isn’t just to learn about each others’ business knowledge, but to learn about the more personal part of each others’ lives.

Many of us gave great presentations, and as this article began, you have to begin with a good background to your story.  I think the key to this article is not just another subset of bulletpoints of how to do a process (although that’s probably where the article heads), but to make you think about what the baseline of any presentation needs to be – a good story.  A lot of times we can get caught up in the details – get caught up in the data.  Presenting the data is so critical, that we forget what the baseline is, and how to bring the story completely together, full circle.  Without a clearly stated statement at the beginning of your presentation, there’s a good chance you’ve already lost a large part of the story you’re trying to tell.

http://hbr.org/2013/06/how-to-give-a-killer-presentation/ar/1

Using PowerPoint Differently!

When I first started using PowerPoint, it was full of ClipArt stick figures and tons of text. Slowly, the art of presentation evolved (thankfully!), and ClipArt was no longer an acceptable way to add images to your slides. But, the evolution didn’t necessarily refine our presentation skills that much. The horrendous ClipArt images were only to be replaced by ‘slideuments’ and chart junk. Now, our slides were full of bar graphs and pie charts that didn’t explain anything and a text overload that bored the pants off of the audience. For this semster’s assignment, I turned to Garr Reynolds, author of Presentation Zen, to help with my information design skills. His book is available on Amazon and I highly recommend it to anyone who wants to work on their slide making skills. As a teaser, I am sharing a few of his tips here, some that I found particularly valuable.

Don’t be afraid to use Multimedia

I have seen multimedia being used effectively by many great presenters. Using video clips or even music can impact how the audience reacts to your presentation and how they retain it. A purely narrative style combined with a text heavy presentation can lose the audience’s interest quickly.

Simplify your visuals

If your visuals can’t be understood in 3 seconds, then redesign them to communicate your idea better. Some images or graphics looks great, but if they are too complicated, then it’s time to ditch them for a simpler design.

Less is More

This is something we have heard a lot in any talk/ article about effective presentation but it is an advbice worth repeating. Reduce the text on your slides. The slides should complement the narrator, not make you redundant. Another aspect of less is more is limiting the ideas to just one main idea per slide. It effectively takes the same amount of time to communicate 3 ideas on 3 slides that it takes to go through 3 ideas on one slide. But it will help your audience process each idea better when they are presented separately.

Back off on the Animation

Animation seems to be the shiny new toy everyone is playing with, but be careful not to overdo it. Animation on every slide can distract the audience from your narration.

Buy the book at : http://www.amazon.com/Presentation-Zen-Design-Principles-Presentations-ebook/dp/B00GXADSUU/ref=sr_1_2?ie=UTF8&qid=1407770573&sr=8-2&keywords=presentation+zen

Telling A Great Story

This past Thursday I, along with the rest of my classmates, had the opportunity to hear our professor, Professor Noonan, tell his story. I thought bout how would I tell a story, in a way that is purposeful and powerful.

I stumbled upon this article describing how to tell a great story. One who can tell a great story holds the power of influence. The good thing is the article tells us that the art of story telling is not something innate, but it is something that can be learned. I know that story telling is something that I would love to improve on. I am pretty loquacious myself so I would prefer to give an interesting story while talking. So what does it take to tell a great story. Well the article explains that you want to ensure that you:

Start With A Message

Know who your audience is and begin with a message that speaks to them or the problem you want to acknowledge

Mine Your Own Experiences

Use personal and life experience to express your message so that the audience can relate to what you’re saying

Don’t Make Yourself The Hero

Let the details of the story be the essence of the story and not yourself.

Highlight A Struggle

The author of the blog describes it best that “A story without a challenge simply isn’t very interesting”

Keep It Simple

Don’t let unnecessary details overshadow the true message

Practice Makes Perfect

Storytelling is an art and like any art it requires practice

Check out the full article below.

http://blogs.hbr.org/2014/07/how-to-tell-a-great-story/


Animations – don’t let them suck the life out of your audience!

My main goal for the summer MP session has been to improve the overall appearance of my PowerPoint slides. I learned that slide design was a weakness of mine during the first semester when I saw some of the Carlos Museum presentations that you all put together.  I was very impressed (and jealous!). I have since spent some time searching for articles on how to improve in this area, and it has been difficult to find tangible recommendations that are easy to apply. Thus, I turned to Amazon and purchased a book called slide:ology.

While I have not read the whole book yet, it has a lot of useful content, and reading it will be part of my personal action plan. I wanted to share one of many useful takeaways in this book with you, which is on animations. Human beings are innately programmed to look at things when they move (fight-or-flight instinct), but PowerPoint animations were not designed with this taken into consideration.

Every time we include animations in our presentations, our audience will turn toward the movement. Even if your animation is subtle, it will momentarily distract our audience. It is important to note that animation, while it may distract, is not always a bad thing. If we use them to help our audience process information more effectively, they can be a huge asset. This requires selecting animations wisely.

Animation should breathe life into your audience, not suck it out. Always choose animation that looks natural and alive, and movement must feel familiar. English is read from left to right, and so our eyes are much more comfortable moving left to right. Keep this in mind if you choose to have words fly-in. A descending object is sensible since we recognize the law of gravity. Although, text dropping down and bouncing all around has no meaning and can be annoying. Objects ascending appear to resist gravity, which can be perceived as illogical. The book goes into more detail on animation recommendations, but the key takeaway is not to include animations for the sake of having animations. They must be selected wisely and help the audience process information.

WP_20140805_002

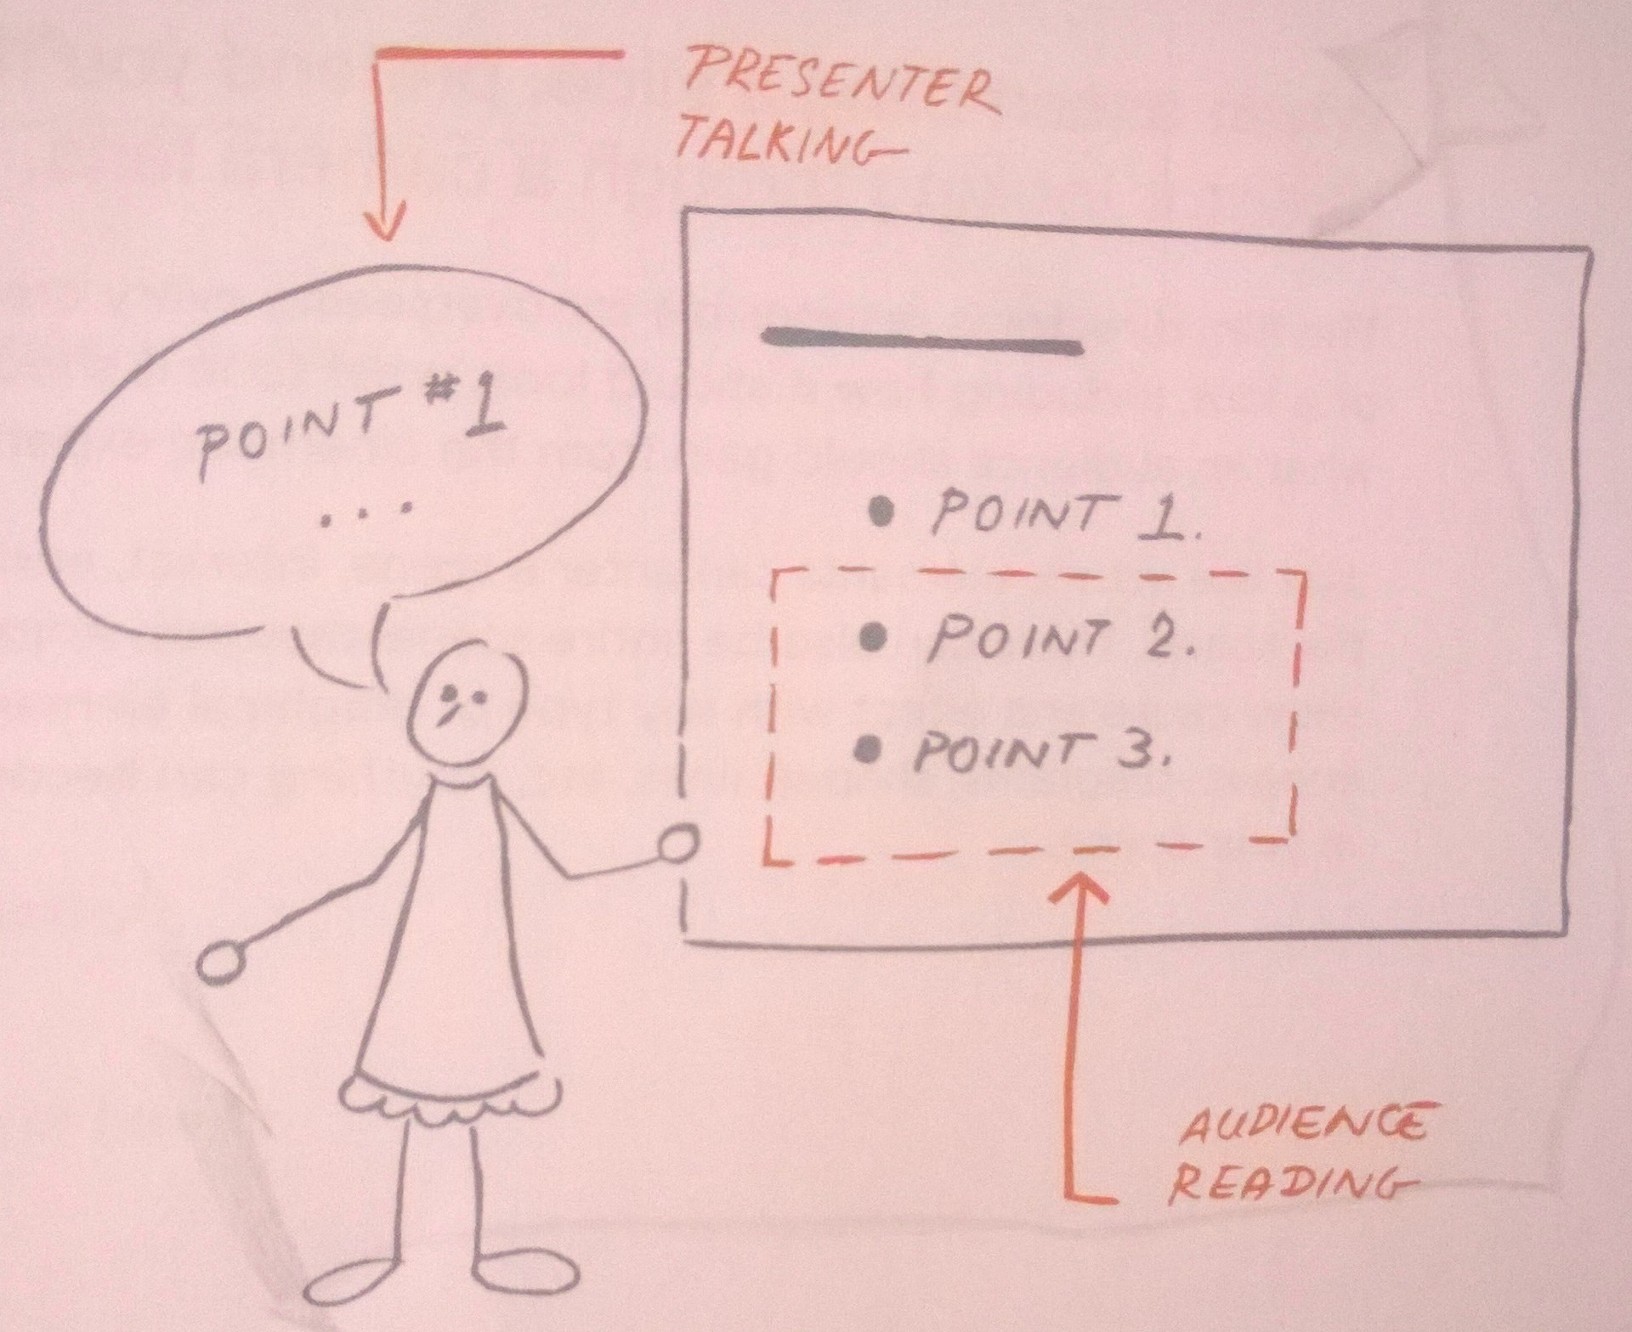
It is fine to animate points, but make sure you hide them until you start discussing them.

Duarte, Nancy. Slide:ology: The Art and Science of Creating Great Presentations. Beijing: O’Reilly Media, 2008. Print.


Crap Circles

It’s Time to Retire ‘Crap Circles’” by Gardiner Morse, may be my favorite HBR article that I have read this semester. Morse makes the point that people often add graphics to PowerPoint presentations without considering if the graphic actually supports their model or idea. Obviously, graphics can be an effective tool for connecting to an audience, more so than a slide deck packed full of text, however, before including a “crap circle” make sure the idea that you are attempting to portray is circular in nature and not linear.

Here are a two bad examples from Morse’s article:

An accounting firm graphic for company services (in a circular graphic): 1) Conception/Start-up Phase, 2) Survival Phase, 3) Growth Phase, 4) Take-off Phase, and 5) Maturity Phase. There is an arrow between each phase pointing to the next. So the question is, how does the fifth phase of Maturity Phase progress into the first phase of Conception/Start-up? It doesn’t.

A solar energy advocacy group use a circular graphic in an attempt to display the relationship between supply and demand for solar power. “Supply Goes Up” as economies of scale are improved, feeds into “Demand Goes Up” as more people and cities begin producing their own power. As “Demand Goes Up” this feeds back into “Supply Goes Up”. Their graphic creates an endless loop of awesomeness for their product and company.

Bottom line, don’t just add random graphics to presentations because they are better than text, be sure to ask yourself if the graphic accurately and effectively portrays the model or idea.

Punt PowerPoint

Like most people, I have always used Microsoft PowerPoint to create presentations. It’s quick, simple, and accessible by most users. However, it’s also these characteristics that have led to so many horrible presentations. Everyone can make a PowerPoint presentation, but it seems that only a few can make good PowerPoint presentations.

Obviously, the content, arrangement, and delivery of a PowerPoint presentation will ultimately determine whether the presentation is a dud or not. However, with the extremely high use rates of PowerPoint, maybe there are other software applications available that will help make a presentation standout against the crowd.

Here is a list of five alternative presentation applications that I came across in an article by Stu Robarts.

1. Prezi (prezi.com) – Instead of the linear progression of PowerPoint slides, Prezi presentations are designed on a large space (similar to a whiteboard) where the user can decide the path that the material should be presented in. Ultimately, the design is intended to help audiences understand how the ideas in the presentation are related to each other.

2. Keynote (https://www.apple.com/mac/keynote/) – Apple’s version of PowerPoint. In typical Apple style, it’s only compatible with Apple products.

3.  Google Slides (google.com) – A stripped-down version of PowerPoint; only the essential tools for creating a slide deck are available. However, the perk is that Slides are integrated into Google Docs. Changes to the presentations are auto-saved and multiple users can simultaneously edit a Slides presentation. The output can be downloaded into PowerPoint format.

4. ClearSlide (clearslide.com) – Designed for sales teams. The primary purpose is web-based presentations. It can be integrated with CRM systems for ease of data integration.

5. SlideDog (slidedog.com) – Every professor should be forced to use SlideDog. It’s not so much a presentation development software, as it is a presentation organizational software. It allows users to drag-and-drop all of their files that will be a part of their presentation (PowerPoint slides, Prezi presentation, web pages, PDFs, videos, etc.) into the SlideDog application and then arrange them into the desired order. When one file is completed, the subsequent file is launched. No more watching the presenter frantically search their desktop for the shortcut to the next element of their presentation.

Data Visualization – Tableau

For starters, check out this video

I sometimes struggle with conveying my analysis (say, in Excel) into a presentation (say, in PowerPoint). The best way to capture the attention of your audience and to deliver an effective presentation is through data visualization. No matter how sound and detailed your analysis, if it is not communicated well to your audience then all of your hard work in performing that analysis was wasted.

Presenting data in a visual format can often be the quickest and most effective ways to convey results of your analysis and capture the attention of your audience. This can communicate a message that may have taken hours to develop in a matter of seconds if done correctly.

One of my favorite new data visualization resources that I am learning to use is called Tableau. Tableau is a software company that was founded in 2003 and does nothing other than data visualization. The company had sales of $34.2 Million in 2010 which grew to an astonishing $232.44 Million in 2013 and the company went public. It is now traded on the NYSE (ticker: DATA). It is extremely intuitive and the product looks amazing. Here is a great video that gives you an overview of the capabilities of Tableau (also linked above).

There are some really revolutionary and interesting methods to communicate data visually that are becoming more and more accepted in business and is thought by many as a way for companies to distinguish themselves among their peers. Often times my company might be similarly positioned to perform work for a given client, and I have seen that a lot of the work we have “won” has come from an effective pitch that highlights the strengths of our organization in a visually compelling manner that engages the client and shows that we can “give meaning to numbers” which is a skill that is hard to quantify.

I would be curious to get any thoughts on your experience with data visualization software and any recommendations you might have.


Other helpful data visualization links:

http://www.scientificamerican.com/article/the-data-visualization-revolution/

http://blogs.hbr.org/2014/04/the-quick-and-dirty-on-data-visualization/

http://fortune.com/2011/11/15/how-tableau-software-makes-business-data-beautiful/

Design Tips for the Novice Graphic Designer

For those of you (like me) who are not designers or naturally gifted in graphic design, this post is for you. We are always being judged by the visual appearance of our presentations, so I think that it is worth improving our capabilities in slide design. I have gathered ten tips that are easy to implement. A link to the article can be found here, which includes a lot of useful illustrations to help get these points across.

#1 Avoid built-in themes

Custom built slides make for a more powerful statement. Templates should only be used for last minute presentations.

#2 Use quality photos

A good photo is one of the easiest ways to make your presentation look better. However, no photo is better than a bad photo. Photos should be unique, attractive, and cliché-free. Where to get free photos? Try Stock XCHING or Flickr. On Flickr, search for “creative commons licensed content,” as those photos are free and usually only require attribution.

#3 Solid colors rock

Yes, it is possible to create an impactful slide with plain design and solid colors. Choose wisely though—too bright or colorful can be bothersome to the eyes. Remember your color wheel from elementary school and use contrast when picking your secondary color.

#4 Select fonts prudently

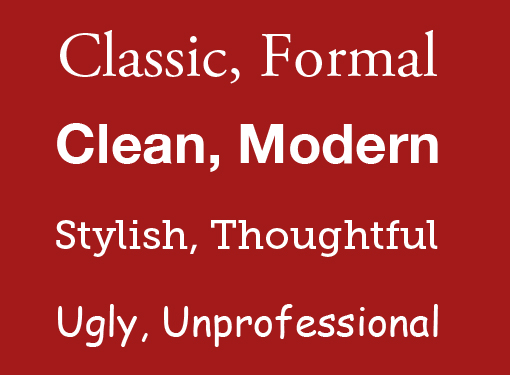
Make sure you understand the message you want to communicate before selecting a font. The classic, old-style serif fonts are formal while sans-serif are more modern.

ds-bp-10

Note: People often think the classics are too boring. They are wrong. These are safe choices.

#5 Make your slides readable

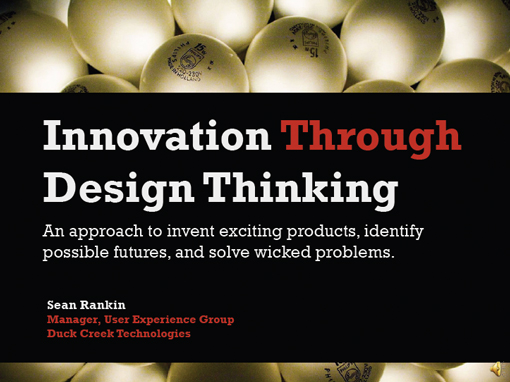
Do not use that amazing photograph as a background if you cannot make your font readable over it. You can get around this by using a simple color bar (example below).

ds-bp-16

#6 Simpler is better

The main content comes from you when presenting, so the slides need to serve as a simplified visual aid. Think of your slides as an outline for your presentation. Additionally, simple slides prevent you from reading them.

#7 Go easy on the bullets

Keep them few in number and simple. Also, they do not need to be self-explanatory because that is what you are there for!

#8 Create clear focal points

Tip #8 may be harder to implement for those with limited design abilities (like me), but the idea is to know where and how to direct your audience’s attention You can do this with color, fonts, text size, and photographs. Without clear focal points, you risk losing your audience.

#9 Design a captivating slide cover

This slide sets the tone for your presentation, so do not ignore it even though it may only be seen for a few seconds. Leaving it up during your introductions helps start the presentation on a positive note and introduces your visual theme.

#10 Add some humor

Your goal is not necessarily to hear laughter. Consider inserting a simple comic or picture that will make your audience smile, as this will help ease any tension in the room. Remember, do not try too hard.

I know that we have some really good slide designers in the program because I have seen some beautiful slides. Anyone have other graphic design tips that the average PowerPoint user can start implementing?


Beyond Powerpoint: Innovative Presentation Tools

The most common presentation software, Microsoft Powerpoint, has remained largely unchanged for the past two decades, and has several well-known drawbacks that impede the ability of presenters to tell their story to the audience.  Fortunately, a new generation of presentation software has recently been developed.  Below I’ve highlighted a several innovative presentation tools designed to promote dialogue,  introduce real-time data into presentations, and foster collaboration between people creating presentations.

Presentation Structure

Powerpoint forces the presenter to present to the audience in a linear format.  The problem with a linear format is that many concepts require multiple dimensions  to display the interconnected nature of the subject matter.  Enter Prezi, a new presentation software to create a ‘spacial narrative’ that not only allows for a 2 or 3 dimensional presentation flow and visualization, but also allows the presenter to stop at any point, and ‘zoom’ to any portion of the overall presentation.  Prezi is especially great for more interactive, discussion based meetings, or for subject matter that does not have a distinctly linear format.   Links to some great ‘sample’ Prezi presentations are provided below.

Real Time Data

A blog article from the Harvard Business Review website called “Presentation Tools That Go Beyond ‘Next Slide Please'” by Nolan Browne notes that ‘presentation tools have largely been static, creating an artificial boundary between the presentation and the outside world.”  Power point slides are great for capturing the state of things at a particular moment in time, similar to how a balance sheet captures the financial situation of a company at the end of a quarter. For presentations that touch on subject matter that is constantly changing, this can cause a lot of extra work in changing the content, or require that the presenter present out of date information.  Several new tools are working to help bring real-time data into presentations.  Zoho Show, a component of Zoho Docs, an online suite of productivity tools similar to Microsoft Office, allows users to insert live media and data from a variety of online sources directly into a presentation.

Collaboration

Powerpoint impedes collaboration in several ways.  First, its difficult to collaborate with others when creating a new presentation.  Presenters either have to create slides separately, and then splice them together to create a whole presentation.  This method usually leads to a presentation with an uneven flow due to differences in writing, style, format etc. of the different presenters slides.  Alternatively, presenters either have to meet in real time to create the presentations, or email revisions back and forth, which can be difficult to manage.  Online collaboration tools like Dropbox and Google Drive help with this issue by creating a centralized document that the presenters can share.

Powerpoint also inhibits in-meeting collaboration between those in the meeting.  For example, if a presenter would like to collaborate with the meeting participants during the presentation to edit a graph, they either need to use the cumbersome and slow feature to imbed an excel plot within Powerpoint, or open up a separate excel file.  A new program called Plotly allows users to create interactive graphs that foster collaboration and discussion about the data.  Google Drive allows multiple users to use a single document at one time, and shows where each users cursor is on the document so that each participant can keep track of where the other users are concentrating.

Here are several sample Prezi presentations.  My goal for this MP course is to create at least one Prezi presentation for my job and gather the meeting participants feedback on the experience.

Source:

Browne, Nolan. “Presentation Tools That Go Beyond “Next Slide Please””Harvard Business Review. N.p., 24 Apr. 2014. Web. 12 July 2014.