Category Archives: 05-Creating & constructing good solutions

Using creative problem-solving techniques, asking “So what?” to get out of the weeds and to the point, stress-testing recommendations for logic, evidence & practicality

Misleading Graphs & Statistical Lies

Graphs and Charts are everywhere, and are excellent tools to visually convey statistics, results, trends, data, etc. There are basically three groups of graphs out there that you’ll find on a regular basis:

1.) Graphs created by people who do know what they are doing

2.) Graphs created by people who don’t know what they are doing

3.) Graphs created by people who do know what they are doing and have manipulated it to intentionally deceive the viewer.

There’s a fine line between number 2 and 3 sometimes, and to be effective business leaders, one skill we must possess is the ability to call “BS”, whether intentional or unintentional. Below is a great book to help uncover a lot of deceptive tricks and a few some examples.

A great book that I highly recommend is: “How To Lie With Statistics“. It’s short, cheap, and uncovers numerous tricks people use with charts, graphs, numbers, and statistics to deceive the reader without breaking the rules.

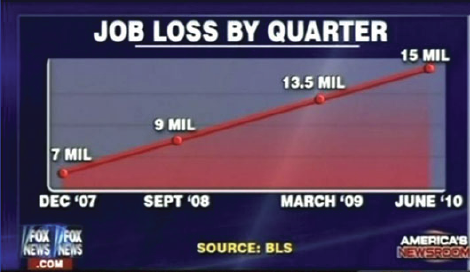
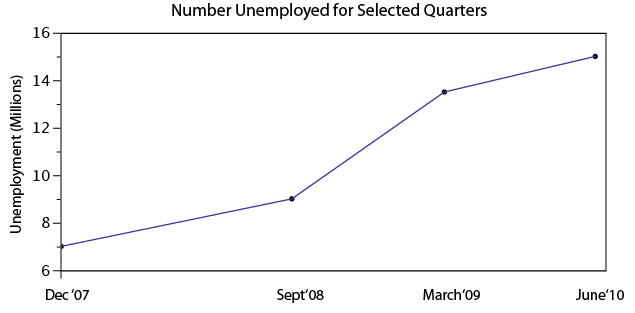
Not to pick on Fox News, but below is a graph that is severely misleading in both the title and the scale of the X-axis. The title leads you to believe the data is by consecutive quarter, and the inaccurate spacing on the X-axis leads to to believe the data is linear.
If you title and plot this data accurately, below is what you would get:
There are many types of errors or tricks that results in the display of data in an inaccurate way. Below are several categories and things to watch out for the next time somebody slaps a fancy looking report down on your desk:

USE OF THE 3D CHART:

Simple use of 3D charts distort the ratio of pies and the height of bars. Notice how Item A and C look more similar in the 3D chart, but flattened, C is less than half of A

ChartMisleading Pie Chart.pngSample Pie Chart.png

 IMPROPER SCALING:

Notice how the intent is to increase the value 3X (Y-Axis), while the perception is that it increased 9X

Improperly scaled picture graph.svg

Comparison of properly and improperly scaled picture graph.svg

The appropriate way to display the increase from 1 to 3 is shown below.

Picture Graph.svg

MISLEADING TRUNCATION:

The truncation on the following graph leads the viewer to believe that group E is nearly twice the size of group A. While sometimes truncation is a great tool in certain situations, it is often misused.

Truncated Bar Graph.svg

Looking at the scale from 0 to 12,000 puts in perspective how slight of a difference there is between groups.

Bar graph.svg

IMPROPER AXIS RANGES:

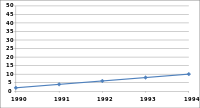
The graph immediately below makes you feel as though the growth over time has been slow and gradual, but a quick change of the axis values gives a completely different perception. Don’t always believe the slopes of lines as they are a function of the Axis values.

Line graph2.svg

Line graph3.svg

OMISSION OF SCALE:

When Scales are left off, the range of the axis is unknown and differences are easily exaggerated or minimized.


Bar graph missing zero1.svg    Example truncated bar graph.svg


A post about the birds and the bees: The Five Habits of Highly Effective Hives

Think back to the first time you had to make a decision in a corporate setting. Take a moment and ask yourself some question:

– What was the problem at hand?
– Did you have all of the information that you needed to accurately make a decision?
– Did you have enough time to think over all of the potential outcomes?
– Or conversely, did you have so much time, that you started to second guess yourself?

Now, I will ask a different question. Think about the first bad decision that you made; a decision that had an outcome that was not what you were hoping for. Ask yourself the same questions. Then ask yourself, what would have been different, had you sought help from those around you, and made a decision as a group, rather than as an individual?

I personally find the group mentality to be frustrating, even maddening, at times, since, typically the more minds that come together, the more lag there will be until a decision. I know that many share my feelings, and in fact, the majority of corporate decisions are made on an individual basis. It is always easiest to have someone to point the blame at if things go wrong. Is this mentality the most effective decision making tool that we have in our arsenal?

In the HBR article entitled, The Five Habits of Highly Effective Hives, Thomas Seeley analogies the group think process to that of Honey Bees. Professor Seeley explains an effective method for maximizing our collective IQ, and ultimately obtaining better solutions then one might without a group. His five step method is below:

  1. Remind the group’s members of their shared interests and foster mutual respect, so they work together productively.
  2. Explore diverse solutions to the problem, to maximize the group’s likelihood of uncovering an excellent option.
  3. Aggregate the group’s knowledge through a frank debate.
  4. Minimize the leader’s influence on the group’s thinking.
  5. Balance interdependence (information sharing) and independence (absence of peer pressure) among the group’s members.

Decision making is arguably the most overlooked competency in organizations today.  People are promoted based on an assumption that they are better decision makers than others.  Yet, group decision making proves to be an insurmountable hurdle for many corporations today. Mastery of both theory and implementation of this soft skill will not only positively impact your corporation, but also your personal brand. Practice this skill and help to raise the collective IQ of the group.


**Sorry, I left out the birds….

The Five Habits of Highly Effective Hives


Building a Better Business Case

I believe that one of the hardest part of giving a great presentation, is the ability to persuade your audience.  Sure, I can give you tons and tons of data to back up why my solution is the best.  But showing data sometimes is not enough.  How you structure how to present the solution is an important aspect as well.

The article “6 Steps to Building a Better Sales Pitch” shares that “You need to get to the heart of why this activity is in their best interest.”  In other words, why should they care?  It suggests that asking the six questions below will help put you on the right path of building a case.

1.  What is the potential value in this situation?
You have to have a logical financial and strategic foundation to create value.

2.  Who do you need to convince?

3.  What motivates each party?
It’s important to understand what drives a stakeholder’s behavior and focus.

4.  What items will you need to seal the deal?

5.  What actions do you want each party to take?
Laying out a specific path the stakeholder definitely helps them visualize how this action plan can work for them.

6.  How can you most effectively communicate the action you want them to take?
Presentation and format depend on your target. Tailor your message to the style of the audience.

Here is a link to the full story: http://www.inc.com/karl-and-bill/6-steps-to-building-a-better-sales-pitch.html

So What? or “Appreciation” – Framework

Hey all, I found some more information regarding the “so what?” framework if you all are interested. According to mindtools.com, the framework is actually called ‘Appreciation.’

  • Appreciation helps us uncover factors that we might have ordinarily missed
  • Originally developed by the military to help commanders gain a comprehensive understanding of any fact, problem or situation that it was faced with in battle
  • You use Appreciation by asking “So What” repeatedly. This helps you to extract all important information implied by a fact.
  • What are the implications of that fact?
  • Why is this fact important?
  • Word of caution: 
  • Can restrict you to one line of thinking. For instance, once you’ve answered your first “So what?” question, you might follow a single line of inquiry to its conclusion. To avoid this, repeat the appreciation process several times over to make sure that you’ve covered all bases. Alternatively, consider using other problem solving techniques in conjunction with this one to ensure a broad-based approach

http://www.mindtools.com/pages/article/newTMC_01.htm

Iron Maiden and Data Analysis: How one Heavy-metal band used data to profit from a revenue-stealing platform

Applying data analysis definitely isn’t always the most exciting field- certainly not as fun as seeing a heavy metal band say Iron Maiden live for instance. With the constant shrinking revenues from traditional album recordings many bands are increasingly reliant on live shows- especially older bands who’s catalog of albums can be easily downloaded in a matter of minutes at no profit to the band or label. This leads them down a road of never ending farewell tours in the same reliable but boring locations.

Enter Iron Maiden: The international super group undoubtedly has fans all over the world but has struggled with their selection of where to tour, despite being one of the most iconic acts in industry. In an innovative use of data analytics for the music industry the band now weighs illegal downloads by location to help determine demand. This has paid off huge in their recent South American tours whereas prior data say that it would have been a disaster and complete opportunity loss. Their most recent tour gained them the distinction of “One of six groups that outperformed the industry” including live documentary sales and one concert alone in Sao Palo that grossed them over $2.5 million. South American attendance and revenue also trumped their previous averages in NA and the EU too.

Hail the Iron Maiden data wonks!

http://www.rollingstone.com/music/news/iron-maiden-using-bittorrent-analytics-to-plot-tours-20131226

Five Easy Presentation Tricks

I am sure  many of you have stumbled upon articles and lists of presentation tips. I have found the following list during my preparation for a recent client presentation. I always search for articles like this right before I present  in hopes that at least one thing will stick.

This Forbes articles mentions the following simple tips:

1. Ask for interaction– simply tell your audience that you want their participation and questions during your presentation (if it’s appropriate, of course).

2. Ask a great question early to get people talking– “if you suffer the silence for a couple of seconds- someone will answer you”.

3. Ask for your audience opinion– it can be a specific/random person if you’re presenting to a small group or just a general answer from the audience if the group is large. This will help you tailor the tone of your presentation.

4. Build in audience discussion and reporting– ask your audience to divide into small group and share their conclusion on a question. Mostly relevant to large-audience presentations.

5. Get moving– don’t be afraid to walk around and use hand gestures, it’s the easiest way to captivate your audience.

All of these tips involve some sort of interaction with your audience and I think that this is the biggest point. Make your audience believe like you care about the presentation and about their opinions and you will win their attention.

http://www.forbes.com/sites/work-in-progress/2014/01/28/five-easy-tricks-to-make-your-presentation-interactive/

A Methodical Approach to Problem Solving

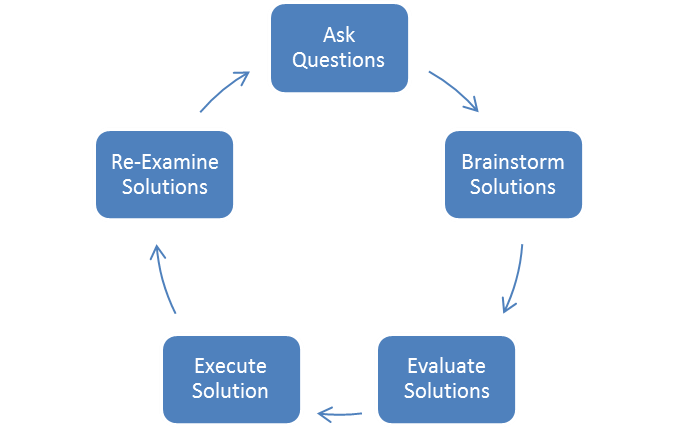
Oftentimes, we equate ‘problem solving’ with ‘critical thinking.’ However, in this case we’re referring to ‘problem solving’ as a method for finding solutions to short-term complications or setbacks. Although strong intuition is important for problem solving, you must also rely on the research and data that you encounter. What is most important is what you do with that combination of intuition and research. Here are the five steps to becoming a better problem solver:

problem-solving-process

  1. Ask a lot of questions to identify the underlying problem. Don’t jump to conclusions.
  2. Brainstorm all of the possible solutions to the problem that you identified.
  3. Evaluate the solutions that you came up with. Determine the feasibility of those ideas.
  4. Execute the most feasible idea. Good problem solvers are responsible for implementing a solution.
  5. Re-evaluate the project throughout its execution. Sometimes you will find out that you are either not solving the underlying problem or there are more problems that need to be solved.

For more information on the myths and facts of problem solving, feel free to visit the link below. This process can be applied in any business setting. By practicing these skills over-and-over, you can become a better problem solver.

http://www.entrepreneur.com/article/217516

Bridging the Gaps for Future Mobile BI Users

Most of us utilize Business Intelligence software mainly on our laptops, but the world has started to drift towards the mobile trends. Many workers travel and rely on tablets or phones for presentation aides yet there are still gaps between the corporate data and these mobile devices. Below are some examples;

Culture Gaps

  • Fast Data vs. BI Reporting
  • Friendly Users
  • Post PC Diversity

Technology Gaps

  • Cloud Platforms
  • Social Interaction
  • All Encompassing Ecosystem

The 2 articles in the embedded links below, focus on the current gaps that we see today between the mobile world and business intelligence in terms of culture and technology. Hopefully in the near future we can bridge the gaps and truly rely on the cloud and other internet services to tailor to our business needs.

making the ordinary extraordinary

http://www.fastcocreate.com/3016916/creation-stories/ricky-gervais-tells-a-story-about-how-he-learned-to-write

“It is so much easier to make the ordinary extraordinary than to try and start off with the extraordinary”  – Ricky Gervais

One of my favorite comedians and writers, Ricky Gervais, has a very curious observation about his own creative process (link above). In the interview he emphasizes how and why he writes the way he does. No matter what the topic is- always start with a story line that is relatable and focus on honesty above all else.

I was thinking about this as you all may struggle with what to present on; start with what you know or is important to you and then use your development plan to help foster a great presentation. Effective communication means convincing the audience or client that you believe in the subject too.


Let the data speak for itself

I’ve been interested in developing models and using data to drive business decisions, and so I was recently reading “Doing Data Science”, which is available at http://www.amazon.com/Doing-Data-Science-Straight-Frontline/dp/1449358659/.  The book contains a fair bit of math, which might make it seem a bit daunting, but I believe it’s worth the read since the authors offer some interesting insights into how to incorporate data analysis and modelling into solving business problems.   There are two sections in particular that I found useful.  The first is on exploratory data analysis, which is the process by which you start to construct a solution to your problem.  As the author states, “Exploratory data analysis (EDA) is often relegated to chapter 1 (by which we mean the ‘easiest’ and lowest level) of standard introductory statistics textbooks and then forgotten about for the rest of the book… But EDA is a critical part of the data science process…”  One of the challenges for me, especially when facing a (messy) business problem, is figuring out what is relevant to the issue, and so I think the framework laid out in this book for doing EDA gives me a good structure for how to approach this step.  This involves both asking what information might be available to help me develop correlations between with the desired business result as well as strategies for teasing out those correlations.  Related to this is the chapter on extracting meaning from data, where the author effectively makes the point that just asking more questions and getting more information doesn’t necessarily lead to a better outcome/model if the data you are gathering is not relevant to the problem at hand.

The book also includes a number of useful vignettes about the real-life application (and misapplication) of data-driven business decisions.  For instance, here is an example from IBM where they wanted to find potential customers for their online business service:

At IBM, the target was to predict companies that would be willing to buy “websphere” solutions.  The data was transaction data and crawled potential company websites.  The winning model showed that if the term “websphere” appeared on the company’s website, then it was a great candidate for the product.  What happened?  Remember, when considering a potential customer, by definition that company wouldn’t have bought websphere yet (otherwise IBM wouldn’t be trying to sell to it); therefore no potential customer would have websphere on its site, so it’s not a predictor at all…  Doing simple sanity checking to make sure things are what you think they are can sometimes get you much further in the end…