Category Archives: 05-Creating & constructing good solutions
Using creative problem-solving techniques, asking “So what?” to get out of the weeds and to the point, stress-testing recommendations for logic, evidence & practicality
In this article, which I found on Business Insider, the author discusses how to be a more effective critical thinker and problem solver. He speaks about how after obtaining a position as a strategy consultant after his MBA, he struggled to solve problems quickly and effectively for clients. A mentor then coached him to “START WITH THE ANSWERS.” This advice that was very foreign to the author at the time. He struggled with this concept but his mentor taught him how to start with the basic structure of a problem they were trying to solve and then develop some hypotheses around that problem based on any given knowledge or prior experience. Then they would put the hypotheses down into a structured diagram with answers that tie to the logic of the problem they were trying to solve. The mentor noted that once they knew the structure of the problem and the possible solutions, they could plan the data that proves or disproves their theories.
This immediately made me think of Issue Trees; a concept I struggled with when first presented to us by Professor Noonan in fall semester. I felt that I could not come up with possible solutions before knowing all of the facts or researching all of the relevant information I needed to try to find the solution. But the mentor in this article also makes a good point that the key to this top-down approach to critical thinking is to not be married to the original answer but by having an original hypothesis or hypotheses, one can begin to focus the data that one collects regarding the solution, as well as begin to socialize the “answers” to illicit feedback and reactions, which can help to hone in on a real and viable solution.
Often it is easier to go somewhere or achieve something if there is a plan in place to direct us, a map toward the goal. Many frameworks have been developed to assist people in solving problems creatively. These models lead to the same goal, an implementation of a solution.
In the 2009 article “Towards a More Realistic Creative Problem Solving Approach”, Jan Buijs, Frido Smulders, and Han van der Meer summarize creative problem solving frameworks from the 1960s and then introduce their own variation.
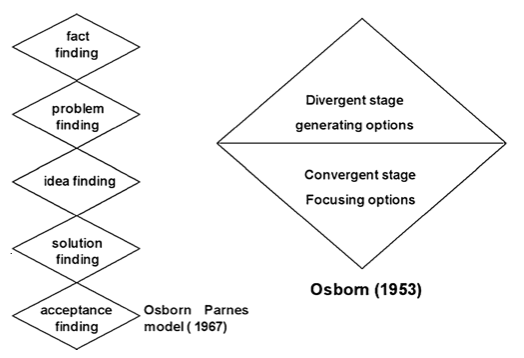
“Creative Problem Solving” (CPS) was first established in 1967 by S.J. Parnes based on the 1953 work by Alex Osborn. Osborn also developed and promoted the concept of ‘brainstorming’ as a tool to solving problems.
The Classical Five-Stage Creative Problem Solving Model. Source: Parnes, 1967
As Buijs writes, further analysis of the Osborn Parnes model brought up questions such as: is CPS truly a linear model? Does the model focus on American culture and isn’t representative of CPS in other cultures? Is the model too content oriented?
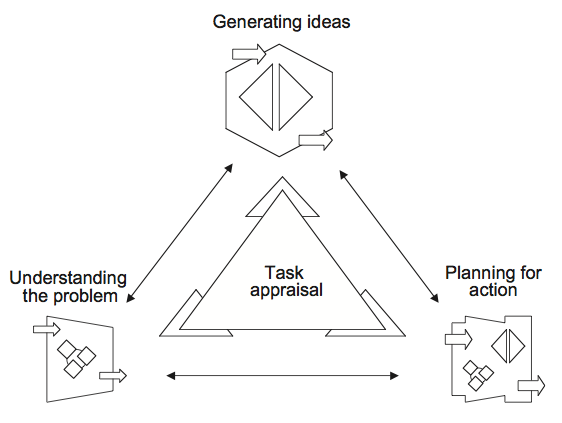
A subsequent model was created in 1993 by Isaksen and Dorval. This model moved away from the linear logic to more circular logic that leaves room for steps to be revisited.
The Ecological Creative Problem Solving Model. Source: Isakesen & Dorval, 1993
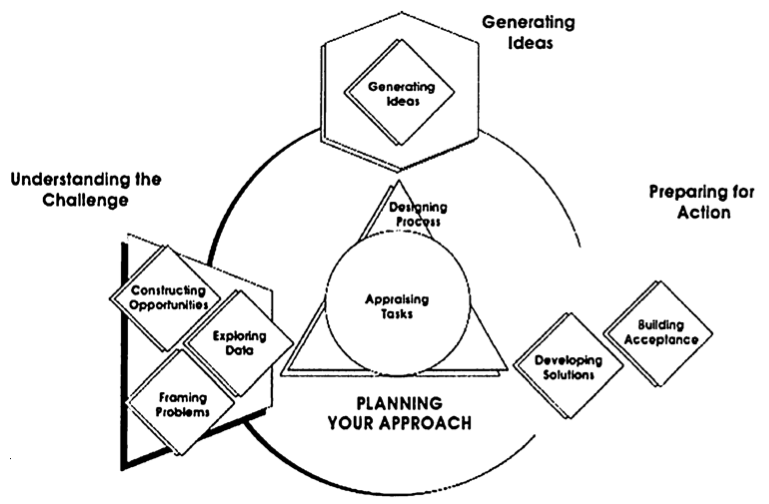
In Isakesen’s 2004 iteration of his CPS model the steps remained interdependent but the steps do not have to occur in a specific order. Isakesen also included subprocesses for each of the original steps.
Version 6.1 of the Creative Problem Solving Model. Source: Isaksen & Treffinger, 2004
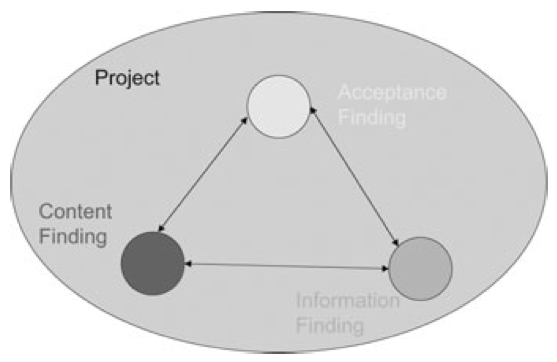
Based on their research, Buijs and team believes the Parnes Osborn CPS model does not offer a complete framework for effective problem solving. In their article, the team introduces a new Creative Problem Solving model. This model is a four-element approach described as “three parallel sub-processes: Content finding, Acceptance finding and Information finding, plus one overarching fourth process: Project management.”
Findings from the Bio-Case: Three Interdependent Processes Concurrently Managed. One Integrated Project – Content Finding, Acceptance Finding and Information Finding. Source: Buijs, 2009
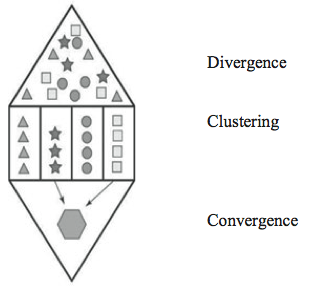
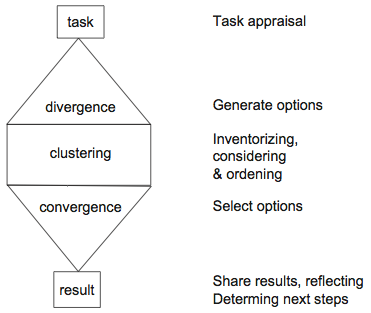
As Buijs explains, “the three parallel processes of Content finding, Acceptance finding and Information finding not only influence each other, they are also mutually dependent.” Together the results of the processes are under the umbrella of the Project Management process which acts “as an overall task appraisal for the total CPS and innovation project, as well as managing all activities in this project.” Each of the three sub-processes “start with their own specific task appraisal, followed by the divergence, clustering and convergence steps and end with a reflection on what has been achieved.” The images below illustrate the flow that occurs in each of the three processes.
The Diverging – Clustering – Converging Module
Buijs claims this model will make CPS more realistic because “in executing one (sub)- process the need for starting one of the other processes is embedded,” they are completely interdependent, not linear.
While it seems odd to create a process for promoting creativity and innovation (something that seems spontaneous and unwilling to conform to processes), this model supports the identification of an innovative solution but also encourages the implementation of the project so the great solutions found during the process are actually implemented.
I believe this is a framework that I can use to start solving my business problems. A project management tool with methods for creative problem solving. In the next week I will use this framework for CPS and see if it meets my everyday needs for finding creative solutions.
———-
Problem Solving In Practice Update: Last week I stated that when an issue was presented to me, I would take the time to understand the issue prior to developing solutions. The beginning of the week was rocky. Twice I thought too quickly and misunderstood questions asked of me. Both times the team members restated themselves and corrected the assumptions I had made by responding without fully listening to their scenarios.
Later in the week, a complicated client request was made of me, a delicate issue regarding one of the people I manage. I was careful to take time to fully understand the situation. I called the client, asked them contextual questions to know the extent of the issue and asked for their preferred solution. After the call, I took time to think of a couple solutions, discussed them with a fellow manager and decided on a solution. I felt more prepared and satisfied with the solution when I shared the response to the client because I had taken the time to fully scope the situation prior to thinking of solutions to their request. Progress!
Sources:
Buijs, J. (2007) Innovation Leaders should be Controlled Schizophrenics. Creativity and Innovation Management, 16, 203–10.
Buijs, J., Frido Smulders, and Han van der Meer (2009) Towards a More Realistic Creative Problem Solving Approach. Creativity and Innovation Management, 18, 286–98.
Isaksen, S.G. and Dorval, K.B. (1993) Expanding Views of CPS: A Synergy Methodology. In Geschka, H., Moger, S. and Rickards, T. (eds.), Creativity and Innovation, The Power of Synergy, Darmstadt, Proceedings of the 4th European Conference on Creativity and Innovation.
Isaksen, S.G. and Treffinger, D.J. (2004) Celebrating 50 years of Reflective Practice: Versions of Creative Problem Solving. Journal of Creative Behavior, 38, 75–101.
Parnes, S.J. (1967) Creative Behavior Guidebook.
Scribner, New York.
If you’re like me, you enjoy getting book recommendations, preferably non-fiction about real people, doing real things, in real places. “Born to Run” by Christopher McDougall is just that and also has several parallels to MP concepts that we can learn from. It begins with a simple subject of running and it’s impact on injuries and transforms into a fascinating story of McDougall’s search for truth and ultimately lead’s to his conclusion that running long distances barefoot is the key to health, happiness, and longevity. From utlra-marathons to Mexican cartels, this book has a little bit of everything and is highly entertaining.
The MP concepts are evident throughout the book as McDougall starts with a simple problem, gathers information, build’s a case for his hypothesis, and then delivers it in a fun and entertaining story. Here’s a link to an overview of the book from McDougall’s website if you’re interested in learning more about it:
This title is clearly tongue-in-cheek, but for me, “For Dummies” can be applied to several areas of mine that need improvement. I suppose those of us who aren’t fortunate enough to practice every viable business skillset regularly may feel the same. But hey, isn’t that why we’re in school? Isn’t that the nature of this project? I digress….
Presentations haven’t been a focus of career thus far, so even the term Information Design is something relatively new. In trying to gain expertise and understanding quickly, I always like to start at the beginning. Where did Information Design originate? What’s its purpose? How is it best used today? To quote professor Makadok, “I’m energized! I’m ready to learn!”
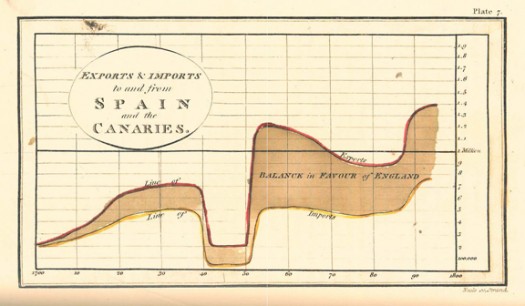
The term “information design” originated in the early 1990’s, however humans have been using visual aids to tell stories for a very long time (think cave paintings, hieroglyphics, etc.). Formal Information Design really hit its stride in the 18th century, with innovators like William Playfair creating some groundbreaking representations of data (http://www.humantific.com/making-sense-of-the-early-sensemakers). Playfair, a Scottish engineer and political economist, invented pie charts, line graphs, and bar charts. And you thought Scotch whisky was Scotland’s greatest invention! All kidding aside, Playfair’s charts were beautiful representations of imports and exports, giving life to previously abstract statistics.
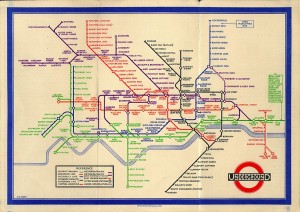
The evolution continued, and fast forward to 20th century: Harry Beck, an English technical draftsman creates the famous London Underground tube map in 1931 (http://britton.disted.camosun.bc.ca/beck_map.jpg).
As a map lover, this is truly an iconic work, and set the standard of urban transit maps that we all know today. To me, Beck’s work truly achieves one of the key goals of information design: clearly visualizing something that is difficult to understand. Can you imagine the complexity of an actual map of the London Underground in its correct scale? It would likely look like an angry cluster of snakes. Beck’s map breaks down the complexity into something that even a novice traveller can visually digest over a cup of tea and a scone.
So with a little history under our belt, what are some tips for taking a modern approach to Information Design? Amy Balliett of Smashing Magazine wrote a fantastic article that gives some great examples of do’s and don’ts, that we can all use to approach our next presentation (http://www.smashingmagazine.com/2011/10/14/the-dos-and-donts-of-infographic-design/):
1) Show, don’t tell: Don’t miss an opportunity to visualize data. In other words, avoid putting into text what can better be conveyed with an image, chart, or graph.
2) If the client wanted an excel chart, they wouldn’t need you: This is clearly aimed at professional info designers, but you get the idea. Step your game up, and get creative! If possible, learning some design platform could really differentiate your skills from the rest of the pack.
3) Typography should not be a crutch: avoid leaning too heavily on fancy fonts that distract from the visualized data. I think this is great advice, and reflects back to “show, don’t tell.”
She goes on to make several other good points, but I’ll get right to the good stuff…
4) Tell a story: Funny how it always comes back to a good story. Great info graphics introduce a problem, back it up with data, and finish with a conclusion.
I highly recommend reading Ballet’s entire article, and hopefully it will provide some inspiration next time you attempt to convey a message visually. Now where did I put that Scotch?
In his book, Presentation Zen: Simple Ideas on Presentation Design and Delivery, Garr Reynolds discusses many different methods and exercises that help you craft a great presentation, including techniques used by TED presenters.
A chapter I find particularly helpful talks about “messages that stick”- why do some presentations make a great impact on you whereas others just fade away minutes after you have stepped out of the conference room.
In order to make a presentation memorable, take a step back, prior to crafting your slides, and think about a time when stories were passed along around the campfire. What made those messages resonate with you? Garr mentions six principles, first introduced by the Heath brothers in their book Made to Stick:
Simplicity. Decide what matter in your presentation and simplify these points. Not everything should be “high priority”.
Unexpectedness. Keep the crowd interested. Create a “gap” in their knowledge by asking questions, then fill that gap with information.
Concreteness. Give a simple speech with real examples, not abstractions. For example: “let’s kill two birds with one stone” is easier than saying “let’s work towards maximizing our productivity by increasing efficiency across many departments”.
Credibility. Most of us are not well-known experts in our field, and usually use data to back us up. Try putting the data in contexts instead of just leaving it “as is”. For example: “enough battery to last you on a flight from NYC to LA” instead of “five hours of battery life”.
Emotions. An easy way to help people “feel something” about your content is to add images.
Stories. Try to provide real-life examples and illustrations instead of simple streams of information.
Think about the last memorable presentation you have witnessed. Most likely, it encompassed most, or all of the points above.
One of my two selected topics focuses on solutions.
A Treasure Map of Solutions
In my preliminary research, I ran across an article in Business Insider, “Nine Steps to Effective Business Problem Solving” by Martin Zwilling. As Zwilling writes, managing any company is all about problem solving. Every employee at every level of the company is constantly evaluating issues and scenarios, coming up with solutions, and implementing them to benefit the company and customers. However, just because everyone participates in the decision making process does not mean everyone has a natural proclivity at finding the best solution for the problem.
In my case, I struggle with ‘solving’ an issue before the person presenting the problem has finished speaking. I need to develop a method where I can process the problem, understand the underlying issues, and identify a couple possible solutions before I jump to a single answer.
Based on Brian Tracy’s “The Power of Self-Discipline,” Zwilling defines the decision making process in his words:
Take the time to define the problem clearly.
Pursue alternate paths on “facts of life” and opportunities.
Challenge the definition from all angles.
lteratively question the cause of the problem.
Identify multiple possible solutions.
Prioritize potential solutions.
Make a decision.
Assign responsibility.
Set a measure for the solution.
Looking at Zwilling’s descriptions of each separate step and my weaknesses, the areas I can most improve when finding a solution are: pausing to understand the problem (no jumping to conclusions!), defining the root cause of the problem, prioritizing potential solutions, and measuring the solution.
These are the four pieces of the decision making process I will research and share in subsequent blog posts. Four pieces that I will use to create my own map of finding ‘golden’ solutions to problems.
Along with further research of the topic, I will be putting my research into practice while at work. My first practice is recognizing when I need to make a decision and simply taking a step back to fully absorb the situation and context of the problem without jumping to conclusions. Look for a story on how I handle this test at work in a subsequent post.
Data driven decisions are the basis of finding solutions that will solve any problem. Utilizing the BI tools are an everyday affair for me, which can often have repercussions should the information be inaccurate. Before we can apply BI to decision making, there is a need to analyze and ensure the integrity of the data.
HBR had a good article regarding the time lost due to looking, identifying and correcting errors in data sets. Time is of essence when it comes to project deadlines and there is nothing I rather not do, than waste time. Companies need to meet deadlines and they give there full trust in data sets. If an error comes up at the last minute when conducting analysis, we often look to quickly fix the data set without fully addressing the root causes.
Previously working in the retail clothing environment, many issues would come up regarding data integrity of our systems. Much of the blame would come back to the IT team and they would try to fix it themselves without going to the respective department who owned the data set. Not only is this inefficient but does not encourage collaboration and communication.
The solutions to this issue is better communication between the data creators and users. Too often do we put a band aid on a mistake and never go to the source. The focus should be shifting the responsibility from the IT team to the managers of data sets. This article gives examples at Chevron and the processes we should be implementing to ensure the right decisions are made with the right information.
I invite others to see if they have utilized these techniques in their companies through their management. What works best for your teams when these issues arise?
 Many frameworks have been developed to assist people in solving problems creatively. These models lead to the same goal, an implementation of a solution.