Category Archives: creativity methods

Dig Deeper to Solve the Underlying Problems

For the sake of switching things up, I thought that I would share with you a show that really knows how to “dig deep” (pun completely intended) into the things that we often take for granted. If you have the time and are interested in finding ways to approach problems in a very different and unique way, I highly suggest you watch “Going Deep with David Rees” on National Geographic (the show just started airing a couple of weeks ago).

Why does this matter and how does it apply to this course? Sure, the topics may seem silly, ranging from learning how to tie a shoe to creating the perfect ice cube for your scotch, but the show does a great job at taking a simple concept and really understanding the components that go into it. Let me explain one of the episodes to help give you some better insight. The steps are rather detailed, but that’s really the point.

How some of us think about digging a hole:

    1. Grab a shovel.
    2. Dig.

How David Rees thinks about digging a hole:

    1. He first addresses the problem and what he’s looking to accomplish (he wants to build a “party hole”).
    2. David went to an experimental mine at the Colorado School of Mines to understand how these subject matter experts dig holes in the mine. From there, he determines that digging a hole into a rock is too dangerous for him and as a result the scope of his project changes.
    3. He goes to a soil biologist to figure out the best combination of sand, silt, and clay to dig the perfect hole (medium loom).
    4. David then goes to visit “Dr. Shovel” at Penn State University where he tests out a number of shovels to determine which ones are most efficient for him to use. From there, he learns that you actually need a couple of types of shovels for different stages of a dig.
    5. David learns that the hole he designed was actually flawed and potentially dangerous if he doesn’t “shore up the sides.” This discovery makes him adapt and change his original plans.
    6. So where does he go to learn how to shore up the sides? He goes to a golf course to learn how to keep his hole intact.
    7. From there, David goes to a cemetery to meet with a professional digger to learn better techniques on how to dig a hole. They first mark down the location and dimensions of the hole they are going to dig.
    8. He then goes to Harvard University to understand how the field mouse burrows a hole. There, he learns that these field mice dig much faster when they dig together instead of alone. As a result, David learns that he will be much more efficient if he has his friends help dig the hole with him.

Whether you’re a project manager, part of the product development team, or your manager asks you to give a presentation on the dynamics of your competition within the industry, you can use some of the analysis and problem solving skills that are utilized throughout this show. That, and you may get a good laugh out of the show as well. And you thought digging a hole was easy?

Spoiler alert. He ends up digging his party hole.

Managing Virtual Teams

We often have to work with people in different cities in my business, and sometimes even different time zones! It can be a huge challenge to coordinate work with people you usually don’t see on a day to day basis.  It seems like more and more companies are moving to teleworking, so I thought it would be good to go over some key tips on managing a virtual team:

1) Organize regular meetings with individuals as well as the team as a whole.

This doesn’t have to be in-person; a phone call or Skype can be just as effective. The main thing is you want to make sure everyone is on the same page. The team needs to feel cohesive and like they are all “in the loop” on what’s happening. We do daily “show calls” with all of our team members in Abu Dhabi, London and here in Atlanta. While this may not be feasible for every team, even a set weekly/monthly phone call can be good to foster communication and a sense of inclusiveness.  A phone meeting is also a good way to address any team problems out in the open.

2) Rotate locations: Try to make sure members spend some time physically with the team in their home base, even if all members can’t all be there at once.

This is a critical part of getting a team to work together effectively. Once you put a face with that voice on the phone, you form a  personal connection with that person. It’s also good to see how people function differently while working in the same room. This gives you the opportunity to confront any workflow or personnel issues. This would also be a good time to help the team bond through a social activity, games, etc.

3) Recognize cultural sensitivity.  Be aware of cultural differences on your team so you can head off any potential issues.

I work with people from a variety of backgrounds and walks of life. It is so important to be aware that people often have very different styles of communication and management.  A good way to head off issues is to make the team aware of the expectations for communication and conflict resolution. For example, a manager could instruct team members to mediate conflict themselves, before rushing to upper management to handle the situation.  Team building exercises and cultural awareness classes could also help.

The biggest takeaway I got from this article is the importance of having good communication!  It’s not easy managing a team flung across different cities or countries. But the team will work a lot more smoothly if everyone is kept in the loop, and any problems are dealt with quickly and transparently.

http://www.forbes.com/sites/iese/2013/06/20/managing-virtual-teams-ten-tips/

The ‘Right’ Strategy For Business Intelligence?

Companies often look for templates or real world examples when it is time to bring a business intelligence system online. While they try to mimic a company similar to theirs, each organization is faced with their own respective needs and challenges. One commonality does exist in most roll outs as the strategy standard; involving end users and thinking big but starting small. This article discusses the best implementation strategy that is shared among companies.

Involving the users allows there to be early buy in from many members of the organization and it promotes the benefits immediately.  With many ideas flowing about, the implementation team is well prepared to deliver the best system. Additionally, pilot programs to test this system in are critical. Mass roll outs without the proper testing can lead to various issues and each department usually has its own pace to adopt these technologies.

Timelines allow for organized planning but its really the end user acclimating to the new system and providing feedback which will determine how long this implementation can take.  Does anyone have any other advice that may complement this over arching advice?

Data Visualization – Tableau

For starters, check out this video

I sometimes struggle with conveying my analysis (say, in Excel) into a presentation (say, in PowerPoint). The best way to capture the attention of your audience and to deliver an effective presentation is through data visualization. No matter how sound and detailed your analysis, if it is not communicated well to your audience then all of your hard work in performing that analysis was wasted.

Presenting data in a visual format can often be the quickest and most effective ways to convey results of your analysis and capture the attention of your audience. This can communicate a message that may have taken hours to develop in a matter of seconds if done correctly.

One of my favorite new data visualization resources that I am learning to use is called Tableau. Tableau is a software company that was founded in 2003 and does nothing other than data visualization. The company had sales of $34.2 Million in 2010 which grew to an astonishing $232.44 Million in 2013 and the company went public. It is now traded on the NYSE (ticker: DATA). It is extremely intuitive and the product looks amazing. Here is a great video that gives you an overview of the capabilities of Tableau (also linked above).

There are some really revolutionary and interesting methods to communicate data visually that are becoming more and more accepted in business and is thought by many as a way for companies to distinguish themselves among their peers. Often times my company might be similarly positioned to perform work for a given client, and I have seen that a lot of the work we have “won” has come from an effective pitch that highlights the strengths of our organization in a visually compelling manner that engages the client and shows that we can “give meaning to numbers” which is a skill that is hard to quantify.

I would be curious to get any thoughts on your experience with data visualization software and any recommendations you might have.


Other helpful data visualization links:

http://www.scientificamerican.com/article/the-data-visualization-revolution/

http://blogs.hbr.org/2014/04/the-quick-and-dirty-on-data-visualization/

http://fortune.com/2011/11/15/how-tableau-software-makes-business-data-beautiful/

Scenario Planning In The Transportation Industry

Atlanta traffic for some of us is a an hour commute or more each day, which can be hampered by construction or accidents. Whether traveling to school or daily job, we can admit that some portions of the city need serious infrastructure investments but we do not see any progress. Public and private sector stakeholders all need to be aligned on objectives and long term planning, yet due to different agenda’s these companies are far apart.

The HBR below discusses the rise of  Freight Flows, an initiative of convening conversations and achieving alignment, and the importance of ‘scenario planning’ in the transportation industry. Scenario planning helps develop point of views for the future and prepare users for a range of possible outcomes rather than placing all your eggs in one basket for one specific prediction. This type of planning helps bring together disparate parties and  effectively ensures that the best capital investments today will best for long term projects.

Delaware Valley Regional Planning Commission (DVRPC) created a web based mapping application to track freight movement throughout the region and the impact it will have on transportation.  DVRPC now intends to use this application as the starting point to educate business and other regional stakeholders on the insights  on other infrastructure projects. Scenario planning is sponsored by the National Cooperative Highway Research program and will help guide the allocation of funds to projects. Stakeholder conversations has become a barrier to continual development of US transportation systems but this strategy could pave the way around that obstacle.

http://blogs.hbr.org/2014/07/to-see-eye-to-eye-on-infrastructure-use-scenario-planning/

The Art and Science of Problem Solving in Any Business


Many of you have been encountering any type of problems to solve for your workplace. I have been dealing with different types of problems over last 15 years, mostly should provide engineering solution to clients. As one of team members or project lead to work together with other colleagues to confront complex issues, I should sometimes develop the solid and comprehensive methodology to overcome internal conflicts. In order to do that, I should have adapted particular skills and processes to achieve team objective, valued business and engineering solution to clients.

I am always seeking and researching for tips and techniques for problem solving – from structuring problems to delivering solutions. I found two short articles which I think useful to share with my MP cohort.

The first article is “Art and Science of Problem Solving in Any Business” and second one is “the most 4 effective ways leaders solve problems” Two authors made two valid points for problem solving skills. The first is “People & Management” and second is “Strategy and Opportunities”.  The People & Management is that a great many problems are actually due to policies and processes being reinterpreted by management as they’re being implemented, which in turn causes confusion about how and when things are supposed to be done. The Strategy and Opportunities is that  defining the problem, as well as in dealing with it in such a way that you not only resolve the immediate issue but use the opportunity to improve your business as strategy. They are very simple and straight-forward thoughts. But, I have overlooked them in the process of establishing the project team and scope as well as delivering final solution to management team.

The Art and Science of Problem Solving in Any Business

The 4 most effective ways leaders solve problems


Making a treasure map to find solutions: Models of Creative Problem Solving

Often it is easier to go somewhere or achieve something if there is a plan in place to direct us, a map toward the goal. Many frameworks have been developed to assist people in solving problems creatively. These models lead to the same goal, an implementation of a solution.
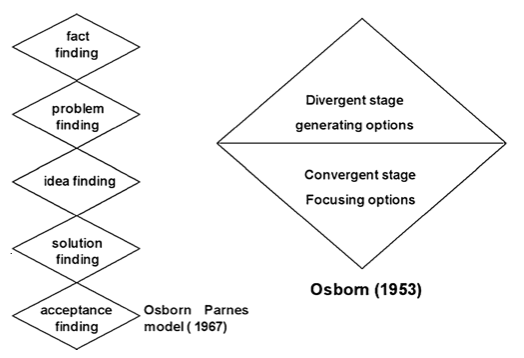
In the 2009 article “Towards a More Realistic Creative Problem Solving Approach”, Jan Buijs, Frido Smulders, and Han van der Meer summarize creative problem solving frameworks from the 1960s and then introduce their own variation.

“Creative Problem Solving” (CPS) was first established in 1967 by S.J. Parnes based on the 1953 work by Alex Osborn. Osborn also developed and promoted the concept of ‘brainstorming’ as a tool to solving problems.

The Classical Five-Stage Creative Problem Solving Model.
The Classical Five-Stage Creative Problem Solving Model. Source: Parnes, 1967

As Buijs writes, further analysis of the Osborn Parnes model brought up questions such as: is CPS truly a linear model? Does the model focus on American culture and isn’t representative of CPS in other cultures? Is the model too content oriented?

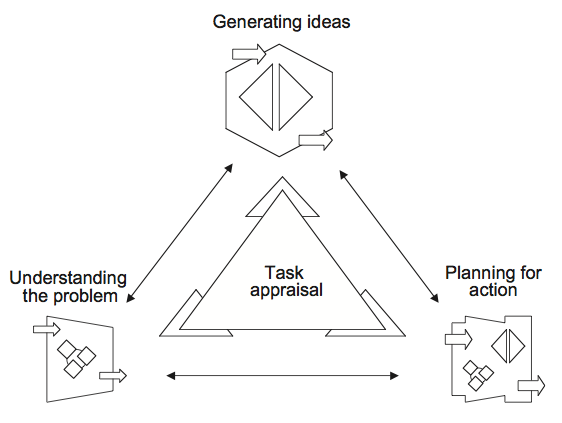
A subsequent model was created in 1993 by Isaksen and Dorval. This model moved away from the linear logic to more circular logic that leaves room for steps to be revisited.

The Ecological Creative Problem Solving Model. Source: Isakesen & Dorval, 1993

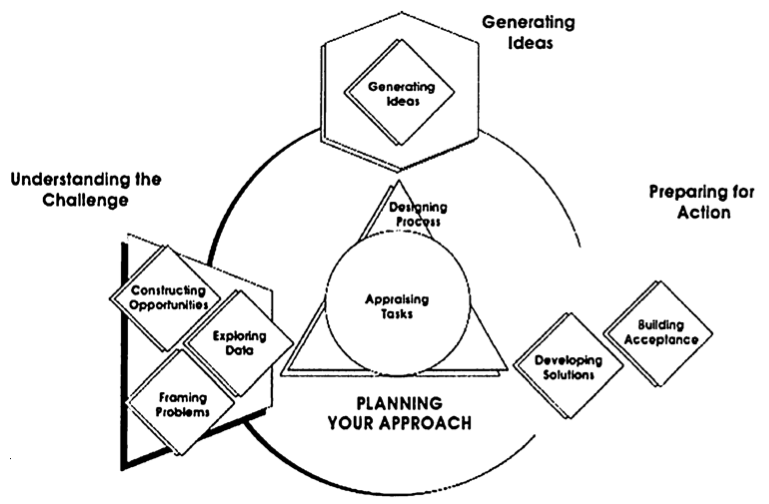
In Isakesen’s 2004 iteration of his CPS model the steps remained interdependent but the steps do not have to occur in a specific order. Isakesen also included subprocesses for each of the original steps.

Version 6.1 of the Creative Problem Solving Model. Source: Isaksen & Treffinger, 2004

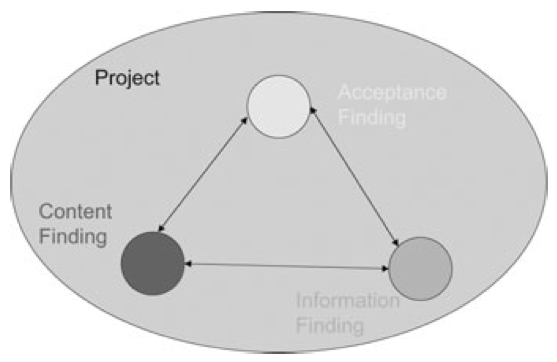
Based on their research, Buijs and team believes the Parnes Osborn CPS model does not offer a complete framework for effective problem solving. In their article, the team introduces a new Creative Problem Solving model. This model is a four-element approach described as “three parallel sub-processes: Content finding, Acceptance finding and Information finding, plus one overarching fourth process: Project management.”

Findings from the Bio-Case: Three Interdependent Processes Concurrently Managed. One Integrated Project - Content Finding, Acceptance Finding and Information Finding. Source: Buijs, 2009
Findings from the Bio-Case: Three Interdependent Processes Concurrently Managed. One Integrated Project – Content Finding, Acceptance Finding and Information Finding. Source: Buijs, 2009

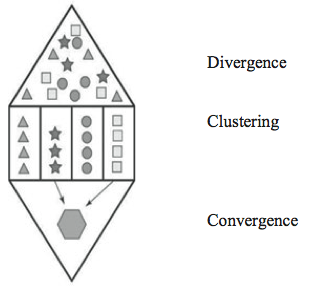
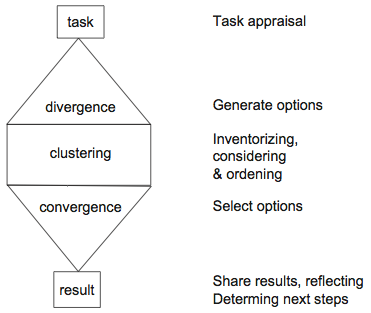
As Buijs explains, “the three parallel processes of Content finding, Acceptance finding and Information finding not only influence each other, they are also mutually dependent.” Together the results of the processes are under the umbrella of the Project Management process which acts “as an overall task appraisal for the total CPS and innovation project, as well as managing all activities in this project.” Each of the three sub-processes “start with their own specific task appraisal, followed by the divergence, clustering and convergence steps and end with a reflection on what has been achieved.” The images below illustrate the flow that occurs in each of the three processes.

The Diverging – Clustering – Converging Module buijs_content2
The Diverging – Clustering – Converging Module

Buijs claims this model will make CPS more realistic because “in executing one (sub)- process the need for starting one of the other processes is embedded,” they are completely interdependent, not linear.

While it seems odd to create a process for promoting creativity and innovation (something that seems spontaneous and unwilling to conform to processes), this model supports the identification of an innovative solution but also encourages the implementation of the project so the great solutions found during the process are actually implemented.

I believe this is a framework that I can use to start solving my business problems. A project management tool with methods for creative problem solving. In the next week I will use this framework for CPS and see if it meets my everyday needs for finding creative solutions.

———-

Problem Solving In Practice Update: Last week I stated that when an issue was presented to me, I would take the time to understand the issue prior to developing solutions. The beginning of the week was rocky. Twice I thought too quickly and misunderstood questions asked of me. Both times the team members restated themselves and corrected the assumptions I had made by responding without fully listening to their scenarios.

Later in the week, a complicated client request was made of me, a delicate issue regarding one of the people I manage. I was careful to take time to fully understand the situation. I called the client, asked them contextual questions to know the extent of the issue and asked for their preferred solution. After the call, I took time to think of a couple solutions, discussed them with a fellow manager and decided on a solution. I felt more prepared and satisfied with the solution when I shared the response to the client because I had taken the time to fully scope the situation prior to thinking of solutions to their request. Progress!

Sources:

Buijs, J. (2007) Innovation Leaders should be Controlled Schizophrenics. Creativity and Innovation Management, 16, 203–10.

Buijs, J., Frido Smulders, and Han van der Meer (2009) Towards a More Realistic Creative Problem Solving Approach. Creativity and Innovation Management, 18, 286–98.

Isaksen, S.G. and Dorval, K.B. (1993) Expanding Views of CPS: A Synergy Methodology. In Geschka, H., Moger, S. and Rickards, T. (eds.), Creativity and Innovation, The Power of Synergy, Darmstadt, Proceedings of the 4th European Conference on Creativity and Innovation.

Isaksen, S.G. and Treffinger, D.J. (2004) Celebrating 50 years of Reflective Practice: Versions of Creative Problem Solving. Journal of Creative Behavior, 38, 75–101.

Parnes, S.J. (1967) Creative Behavior Guidebook.
Scribner, New York.


Information Design For Dummies

This title is clearly tongue-in-cheek, but for me, “For Dummies” can be applied to several areas of mine that need improvement. I suppose those of us who aren’t fortunate enough to practice every viable business skillset regularly may feel the same. But hey, isn’t that why we’re in school? Isn’t that the nature of this project? I digress….

Presentations haven’t been a focus of career thus far, so even the term Information Design is something relatively new. In trying to gain expertise and understanding quickly, I always like to start at the beginning. Where did Information Design originate? What’s its purpose? How is it best used today? To quote professor Makadok, “I’m energized! I’m ready to learn!”

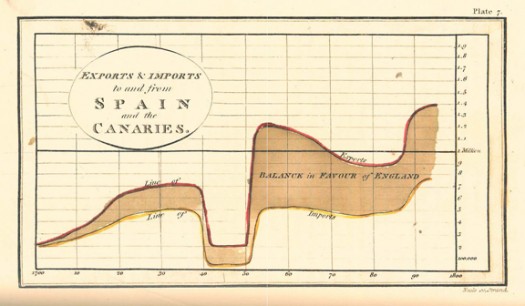
The term “information design” originated in the early 1990’s, however humans have been using visual aids to tell stories for a very long time (think cave paintings, hieroglyphics, etc.). Formal Information Design really hit its stride in the 18th century, with innovators like William Playfair creating some groundbreaking representations of data (http://www.humantific.com/making-sense-of-the-early-sensemakers). Playfair, a Scottish engineer and political economist, invented pie charts, line graphs, and bar charts. And you thought Scotch whisky was Scotland’s greatest invention! All kidding aside, Playfair’s charts were beautiful representations of imports and exports, giving life to previously abstract statistics.Playfair13-525x306

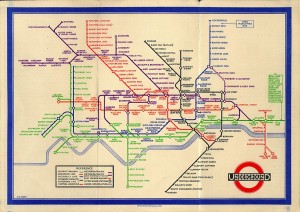
The evolution continued, and fast forward to 20th century: Harry Beck, an English technical draftsman creates the famous London Underground tube map in 1931 (http://britton.disted.camosun.bc.ca/beck_map.jpg).

beck_map

As a map lover, this is truly an iconic work, and set the standard of urban transit maps that we all know today. To me, Beck’s work truly achieves one of the key goals of information design: clearly visualizing something that is difficult to understand. Can you imagine the complexity of an actual map of the London Underground in its correct scale? It would likely look like an angry cluster of snakes. Beck’s map breaks down the complexity into something that even a novice traveller can visually digest over a cup of tea and a scone.

So with a little history under our belt, what are some tips for taking a modern approach to Information Design? Amy Balliett of Smashing Magazine wrote a fantastic article that gives some great examples of do’s and don’ts, that we can all use to approach our next presentation (http://www.smashingmagazine.com/2011/10/14/the-dos-and-donts-of-infographic-design/):

1) Show, don’t tell: Don’t miss an opportunity to visualize data. In other words, avoid putting into text what can better be conveyed with an image, chart, or graph.
2) If the client wanted an excel chart, they wouldn’t need you: This is clearly aimed at professional info designers, but you get the idea. Step your game up, and get creative! If possible, learning some design platform could really differentiate your skills from the rest of the pack.
3) Typography should not be a crutch: avoid leaning too heavily on fancy fonts that distract from the visualized data. I think this is great advice, and reflects back to “show, don’t tell.”

She goes on to make several other good points, but I’ll get right to the good stuff…

4) Tell a story: Funny how it always comes back to a good story. Great info graphics introduce a problem, back it up with data, and finish with a conclusion.

I highly recommend reading Ballet’s entire article, and hopefully it will provide some inspiration next time you attempt to convey a message visually. Now where did I put that Scotch?