In my earlier post on this subject, I discussed the history of information design and some best practices associated with its use today. It’s great to consider the past and present of this art, but what about the real context for most of us on a day-to-day basis?
In my career thus far, I haven’t to do much of this type of work. In fact, between undergrad and business school, I don’t think I touched PowerPoint more than a few times. Well, those days are over! I’ve been serving in my new role at Arby’s for almost a month now, and I’ve already been asked to create what we call “one pagers.” These summaries are a brief overview of a topic, usually presented via a PowerPoint slide. It’s important that they present only the most critical information, and are used during the numerous meetings that happen on a daily basis.
So what role do infographics play? Let’s just say that they’re a team player and not the star. Our one-pagers are generally mostly text, organized in a way that is very clear and easy to read. The graphs, data, etc. typically plays a support role or is left out altogether, only to be presented in more thorough presentations. The key here is to extract the data into bullet points or going beyond that, make your point or recommendation based on the data. I found a good example of the general form we use on, of all places, the Citizens for Public Justice website. I agree with their format, and it can be seen here: http://www.cpj.ca/content/how-write-one-page-brief
I still believe that I will have to create a good bit of graphs and charts, however I think the true, modern form of infographics are typically left up to the design types and corporate communications department. Luckily, the organization is fairly flat and meeting with those people, collaboration, and learning from them is eminent.
Although I may not be presenting as much of this type of work as I had expected, I believe I will certainly know how to create meaningful visualizations of data to support my future recommendations. I look forward to the challenge and continued learning!
I’ve always been fascinated by the Space Race of the 1960s. I am particularly amazed by the fact that in less than ten short years we went from considering space the realm of Hollywood and science-fiction to the kind of reality that you could watch live on the television in your living room. How did they do it? Computers? A bottomless budget? Sure, there were major advances in computer processing and increases in federal financing, but how did they go from being behind the Soviet Union to surpassing them en route to being the first nation to rendezvous, dock and land on the moon? I believe it has a lot to do with the team management practices that were exercised by NASA’s space flight leadership team. In former Flight Director Gene Kranz’s book Failure is not an Option he described how the NASA team was able to advance quickly through the Apollo program towards landing on the moon by saying, “Apollo succeeded at critical moments like this because the bosses had no hesitation about assigning critical tasks to one individual, trusting his judgment and then getting out of his way.” The basis for this trust was largely due to the emphasis NASA leadership placed on communicating, mapping out systematic solutions to complex problems, and establishing clear responsibilities for solving those problems and executing their designed solutions.
What’s interesting is that this is exactly what we were taught to do in MP. Upon reviewing the slides Professor Noonan presented during the Fall Semester, it is apparent that many of the lessons shared by our own “decision Jedi” were actually put to use by NASA in their effort to win the Space Race. Two slides, in particular seem applicable, which I’ve paraphrased below:
Intro Deck, Slide #24:
MP learning objectives and topics include: (a) defining the central problem in a situation; (b) connecting that problem to effective teamwork; (c) developing and delivering valuable insights; and (d) connecting those insights to effective action. “Excellence is an art won by training and habituation.” – Aristotle
Part 3 Deck, Slide #2:
How can we organize and manage team effort? (A) Appropriate work stream: (i) Targeted analyses, (ii) Spanning the tree, (iii) Driven by issues, and (iv) Focused using hypotheses; (B) Productive: (i) Focused info, resource needs; (ii) Clear, specific deliverables and declines; and (C) Effective use of team: (i) Responsibility and (ii) Coordination.
During the Space Race, the engineers and test pilots at NASA trained religiously, and spent extensive time developing rules and procedures for their flights. Since no one had ever flown in space before, each new mission provided an opportunity to literally “write the manual” on how certain objectives should be reached. Because the lives of the colleagues and friends, as well as the future of the nation, depended upon their precision, these engineers would try to consider every step of every mission from all angles before lighting a single rocket. In doing so, they were essentially asking themselves closing their eyes and asking themselves, “what do we need to do to achieve X?” and then building out mental “issue trees,” branches of which were then assigned to specific departments or team members to research, resolve and execute.
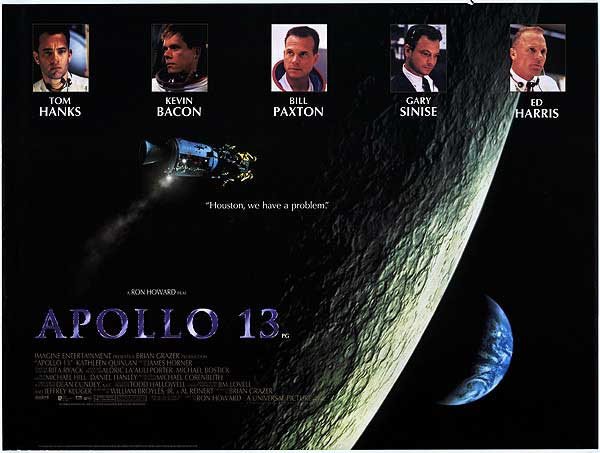
Apollo 13 (Theatrical Poster)
Although this kind of structured team management and leadership was a part of each stage of the Space Race, the most enduring display came in April of 1970, during the Apollo 13 mission. One of the most detailed accounts of how the Apollo 13 problems were tackled can be found in Flight Director Gene Kranz’s account in Failure is not an Option. Kranz describes how he broke the task down into key parts (e.g., power, trajectory, using the LM as a lifeboat for three men when it was designed for two, etc.) and then began in a structured and disciplined form of “brain storming” (or what some might call “brain steering”) during which every option was explored to ensure that the issue tree was mutually exclusive and collectively exhaustive.Short of reading Kranz’s book yourself, you can get an idea of what happened during the Apollo 13 mission by viewing the 1995 film starring Tom Hanks. Below are some key points in the film and links to YouTube clips that help provide a nice representation of this kind of team management:
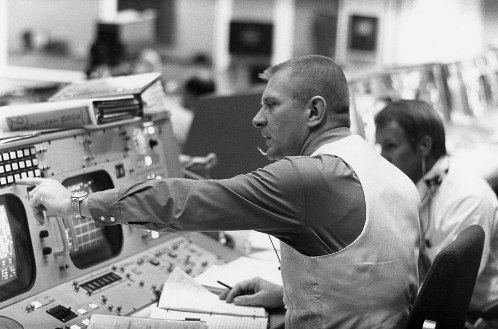
Flight Director, Gene Kranz – sporting his famous “white team” vest
1) Shortly after the explosion occurs on the Command Module, mission control begins to devolve into chaos over the news that the Apollo 13 spacecraft is mysteriously venting oxygen into outer space. Gene Kranz focuses the group by saying, “Let’s work the problem people, let’s not make things worse by guessing.” (NOTE, only the first 42 seconds of this clip are from the scene that I’m referring to here, you can ignore the rest). Kranz’s statement reframes the crisis as a problem that can be solved, not a moment for mindless panic, and in so doing he returns his team to the tasks they’ve been trained to do: solve space flight problems in a systematic fashion. Moreover, although it’s hard to appreciate from this short clip, you can get a sense for how direct the lines of communication are in mission control. Every person has a role to play and their area of expertise is distinct. Gene Kranz sources information from each of them and provides specific instructions to each group. He never says, “somebody go do that” it’s always clear communication directed at a specific individual or sub-team so everyone knows who is responsible for generating the answer to a specific question.
2) After relocating the astronauts to the LM (a/k/a Lunar Module, LEM), Gene Kranz makes it clear that the old flight plan is being tossed out the window and he focuses the team’s brainstorm efforts on the key question, “How do we get our people home?” When the sling-shot around the moon idea is presented a debate ensues, displaying how team members are wearing “different colored hats,” to essentially test the strength of the proposed solution.
3) When faced with the challenge of managing the power supply, a man named “John” proposes that everything must be turned off otherwise the LM will run out of power in 16 hours, not 45 hours. A cacophony of negative responses fills the room but Gene Kranz assesses the situation, makes the decision to power down the LM and moves on with the remaining team members to say they need to find a squeeze every amp out of the electronics in the spacecraft –“failure is not an option!” This particular scene displays the trust Kranz placed in his team members and their expertise, and, again, the power of positioning each challenge as a problem that can be solved by specific team members or sub-groups of team members.
4) As one team works on the electronic power issues, another is just discovering that the CO2 levels in the LEM are rising and that the filters from the Odyssey and the LEM are not compatible. This leads to the famous “Square peg in a round hole” problem. This might be the most incredible problem solved during the mission, and if you’d like to read more about it, you can do so here. The work done by Ed Smylie’s “tiger team” unquestionably saved the lives of the three astronauts, but again it shows the value of breaking a big problem (“how do we get our guys home?”) into smaller questions and dividing the task of researching and resolving those problems up to be the responsibility of smaller groups or individuals.
Years later, the Apollo 13 the flight commander, Jim Lovell, during a separate interview, suggested the Apollo 13 mission and provides several key takeaways for business leaders:
Identify the problem and figure out what you have to solve it;
Communicate – you need to share information with your team members in order to solve the problem;
Good leadership and good teamwork are marked by perseverance and initiative.
Thanks to this structured approach to problem solving and team management, NASA was able to bring the crew of Apollo 13 home and in the process they achieved what is largely regarded as the administration’s finest hour. If you’re interested in learning how you too can achieve this level of success within your own organization, I would invite you to review the aforementioned slides and check out the movie Apollo 13 on iTunes or your preferred viewing platform. Remember, “FAILURE IS NOT AN OPTION!”
Apollo 13 crew members Fred W. Haise, James A. Lovell, and John L. “Jack” Swigert, arriving at the USS Iwo Jema after safely landing in the South Pacific Ocean.
I sometimes struggle with conveying my analysis (say, in Excel) into a presentation (say, in PowerPoint). The best way to capture the attention of your audience and to deliver an effective presentation is through data visualization. No matter how sound and detailed your analysis, if it is not communicated well to your audience then all of your hard work in performing that analysis was wasted.
Presenting data in a visual format can often be the quickest and most effective ways to convey results of your analysis and capture the attention of your audience. This can communicate a message that may have taken hours to develop in a matter of seconds if done correctly.
One of my favorite new data visualization resources that I am learning to use is called Tableau. Tableau is a software company that was founded in 2003 and does nothing other than data visualization. The company had sales of $34.2 Million in 2010 which grew to an astonishing $232.44 Million in 2013 and the company went public. It is now traded on the NYSE (ticker: DATA). It is extremely intuitive and the product looks amazing. Here is a great video that gives you an overview of the capabilities of Tableau (also linked above).
There are some really revolutionary and interesting methods to communicate data visually that are becoming more and more accepted in business and is thought by many as a way for companies to distinguish themselves among their peers. Often times my company might be similarly positioned to perform work for a given client, and I have seen that a lot of the work we have “won” has come from an effective pitch that highlights the strengths of our organization in a visually compelling manner that engages the client and shows that we can “give meaning to numbers” which is a skill that is hard to quantify.
I would be curious to get any thoughts on your experience with data visualization software and any recommendations you might have.
Although my GBS colleague Jag Sheth is best known as a professor of marketing, when digging around in almost any field of management, sooner or later one finds his influence if not some of his actual work.
Management Practice is no different, and that doesn’t surprise me at bit, given Jag’s years of experience thinking and writing about the practice of marketing, on top of his theoretical and scholarly work.
One of the connections between Jag and MP can be found in his 2000 book Clients for Life, which he wrote with Andrew Sobel. As you know, we frame the MP course in a way that causes us to think of internal as well as external “clients.” In effect, we can see clients everywhere, even if we’re not explicitly working with them as someone in a professional services firm might.
Given that, Jag’s book offers some good advice for all of us who seek to have, as his introduction begins, “loyal clients who come back to use year after year.” We want that “double win” I keep mentioning: being seen as doing good work, and having that work credited with helping others make good decisions and take action.
Jag and his co-author frame their goal as moving people – you, for example – from “expert-for-hire” to “trusted advisor.” They want to help with professional growth, clearly. As such, it also intersects with the Leadership Development course that lies ahead for you after you complete MP.
Tackling the entire book is likely more than you need to take on during your MBA studies, but here is a PDF with the Introduction and Chapter One, to give you a sense of what they’re recommending. That might help you determine if and when you might want to take in the entire book. [The GBL is going to place this on e-reserves, and when it’s available by that route I’ll replace this attachment with a link.]