Category Archives: slide-craft

Design Tips for the Novice Graphic Designer

For those of you (like me) who are not designers or naturally gifted in graphic design, this post is for you. We are always being judged by the visual appearance of our presentations, so I think that it is worth improving our capabilities in slide design. I have gathered ten tips that are easy to implement. A link to the article can be found here, which includes a lot of useful illustrations to help get these points across.

#1 Avoid built-in themes

Custom built slides make for a more powerful statement. Templates should only be used for last minute presentations.

#2 Use quality photos

A good photo is one of the easiest ways to make your presentation look better. However, no photo is better than a bad photo. Photos should be unique, attractive, and cliché-free. Where to get free photos? Try Stock XCHING or Flickr. On Flickr, search for “creative commons licensed content,” as those photos are free and usually only require attribution.

#3 Solid colors rock

Yes, it is possible to create an impactful slide with plain design and solid colors. Choose wisely though—too bright or colorful can be bothersome to the eyes. Remember your color wheel from elementary school and use contrast when picking your secondary color.

#4 Select fonts prudently

Make sure you understand the message you want to communicate before selecting a font. The classic, old-style serif fonts are formal while sans-serif are more modern.
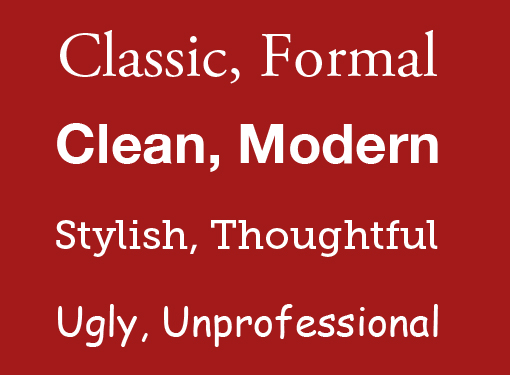
ds-bp-10

Note: People often think the classics are too boring. They are wrong. These are safe choices.

#5 Make your slides readable

Do not use that amazing photograph as a background if you cannot make your font readable over it. You can get around this by using a simple color bar (example below).

ds-bp-16

#6 Simpler is better

The main content comes from you when presenting, so the slides need to serve as a simplified visual aid. Think of your slides as an outline for your presentation. Additionally, simple slides prevent you from reading them.

#7 Go easy on the bullets

Keep them few in number and simple. Also, they do not need to be self-explanatory because that is what you are there for!

#8 Create clear focal points

Tip #8 may be harder to implement for those with limited design abilities (like me), but the idea is to know where and how to direct your audience’s attention You can do this with color, fonts, text size, and photographs. Without clear focal points, you risk losing your audience.

#9 Design a captivating slide cover

This slide sets the tone for your presentation, so do not ignore it even though it may only be seen for a few seconds. Leaving it up during your introductions helps start the presentation on a positive note and introduces your visual theme.

#10 Add some humor

Your goal is not necessarily to hear laughter. Consider inserting a simple comic or picture that will make your audience smile, as this will help ease any tension in the room. Remember, do not try too hard.

I know that we have some really good slide designers in the program because I have seen some beautiful slides. Anyone have other graphic design tips that the average PowerPoint user can start implementing?


Edward Tufte on PowerPoint

This is an interesting read on the pitfalls associated with PowerPoint presentations. One of the things that I am focusing on improving this semester is my presentation skills, and I found this article, The Cognitive Style of PowerPoint by Edward Tufte, to be helpful with regards of how to present data in a meaningful way. While you may find some of his opinions to be extreme, I believe that he still has many valid points and that his arguments are logical.

Even if you do not read this entire article, at least see his demonstration of Abraham Lincoln’s Gettysburg Address via PowerPoint presentation on page 12 along with the section on improving our Presentations on page 22. I’ve included some highlights of the article below:

The Cognitive Style of PowerPoint

PP convenience for the speaker can be costly to both content and
audience. These costs result from the cognitive style characteristic of the standard default PP presentation: foreshortening of evidence and thought, low spatial resolution, a deeply hierarchical single-path structure as the model for organizing every type of content, breaking up narrative and data into slides and minimal fragments, rapid temporal sequencing of thin information rather than focused spatial analysis, conspicuous decoration and Phruff, a preoccupation with format not content, an attitude of commercialism that turns everything into a sales pitch.

Extremely Low Resolution of PowerPoint 

Visual reasoning usually works more effectively when the relevant information is shown adjacent in space within our eyespan. This is especially the case for statistical data, where the fundamental analytical act is to make comparisons.

Bullet Outlines Dilute Thought

By leaving out the narrative between the points, the bullet outline ignores and conceals the causal assumptions and analytic structure of the reasoning.

Bullet outlines might be useful in presentations now and then, but sentences with subjects and verbs are usually better. Instead of this type of soft, generic point found in many business plans.

Improving Our Presentations

Designer formats will not salvage weak content. If your numbers are boring, then you’ve got the wrong numbers. If your words or images are not on point, making them dance in color won’t make them relevant. Audience boredom is usually a content failure, not a decoration failure.

Never use PP templates for arraying words or numbers. Avoid elaborate hierarchies of bullet lists. Never read aloud from slides. Never use PP templates to format paper reports or web screens.

Paper handouts at a talk can effectively show text, numbers, data graphics, images. Printed materials, which should largely replace PP, bring information transfer rates in presentations up to that of everyday material in newspapers, magazines, books, and internet screens.


The Art of an Executive Summary

In my job I give 3 or 4 client-facing presentations per week.  These presentations are often very similar, and over the course of my career there are very few new issues in my specific field.  It can be very simple to reuse an old presentation with a few adjustments.  However, it is important to understand that this may be the first time your client has come across this particular issue or undertaking.  An easy an effective was to frame an issue and have your audience moving in the same direction is an executive summary page. 

Below is an article written by a CBS contributor outlining an effective executive summary. The key is to not approach the summary in chronological order… problem, solution, and outcome. If the goal of the presentation is a sale or a call to action, end with that.  Structure the summary beginning with current problem, the desired outcome, and then the solution. This ending will provide a nice transition into the meat of the work you will present.

The goal is to establish your credibility by displaying your understanding of the customer needs, provide a compelling value proposition and why your solution is unique.

http://www.cbsnews.com/news/the-art-of-the-executive-summary/

Sharing a Helpful Resource

If your job is anything like mine, you use Microsoft Excel and/or PowerPoint on a regular (if not daily) basis. If you use either of these applications in conjunction with each other (which I know all of us have in our prior MP presentations), I have a very helpful resource to share with you.

One of the biggest challenges that I have faced is effectively incorporating data (particularly from Excel) into a concise PowerPoint presentation. Given that Excel and PowerPoint are both made by Microsoft, you would think that using these two applications in conjunction with one another would be fairly seamless and potentially even synergistic (1 + 1 = 3, right?).  However, integrating Excel and PowerPoint is not always straight forward, and conveying key takeaways rather than “data dumping” an entire financial model into your presentation can be a challenge. Additionally, I think that most of us are typically better at one than the other which doesn’t make things any easier.  I certainly have found this to be the case for myself, and while I have a strong background in using Excel, I have a lot of “room to grow” in terms of incorporating financial data from huge bulky models into a clean and concise presentation that conveys the underlying data effectively.

As I have searched for tools, resources, and articles giving guidance on this very topic, I have come across a particularly helpful website that I wanted to share with our class and hope that you will find it to be as useful as I have. This website is called ‘Think Outside the Slide’ and is as close to a “one stop shop” as I have found for guidance on just about everything relating to creating powerful presentations, with literally thousands of articles neatly organized by topic, as well as video tutorials if you’re more of a visual person. If you use Excel or PowerPoint at all, there is likely a specific article with tips and guidance on how to more effectively use the applications in a context relevant to you.

These are just a few that I have begun to frequently reference to give you a snapshot:

  • Using Excel Data in Powerpoint Presentations
  • Slide Design, Creation, and Editing
  • Linking Excel Data (and other content) to PowerPoint so that data in slides automatically updates
  • Tips on effectively cleaning up and animating graphs
  • Creating powerful visuals using Excel Data (waterfall graphs, diverging stacked bar charts, treemap diagrams, proportional shape comparisons, etc…)

For many business professionals, myself included, Excel and PowerPoint are critical tools, and learning to use data effectively in PowerPoint presentations can take time but is versatile skill with application to countless professions that can help to distinguish yourself from your peers/co-workers, and add value to your clients. I hope you find this to be a helpful resource, please feel free to share any other resources that you frequently use and have found helpful in your career. Thanks!

Helpful links referenced in this post:

http://www.thinkoutsidetheslide.com/free-resources/

http://www.thinkoutsidetheslide.com/using-excel-data-in-a-powerpoint-presentation/

http://www.thinkoutsidetheslide.com/articles/

Less is More, Right?

In the article titled “My Seven-Step Method for Creating a Presentation When the Stakes are High” by Carmine Gallo  http://www.forbes.com/sites/carminegallo/2013/12/18/my-seven-step-method-for-creating-a-presentation-when-the-stakes-are-high/, Gallo accentuates one of the great points of creating a slide deck – less information and more pictures increases retention of the material. Specifically, Gallo identifies that only 10% of information conveyed verbally is retained by the audience, but this increases to 65% if the verbal concept is coupled with a relatable graphic or picture. This article also addresses a number of techniques for preparing to give the presentation, many of which have been covered in posts elsewhere.

I believe this concept extends far beyond the basics of slidecraft. We have seen other posts this semester about dealing with distracted audiences, so let’s evaluate this concept in that scope. Imagine that you are watching a presentation where the presenter is exploring a complex issue in detail. Suppose the slide looks something like this:

(from Gallo article)

How distracted will you be, specifically if the verbal presentation does not align with the visual? In my case, I would likely be even more confused if the presenter attempted to step through each part of this obviously overrun slide. By simplifying the presentation of the slide, the audience is allowed to focus on the information. I liken this idea to introducing the audience to the information in lieu of confronting them with it. The presentation and presenter will be far better received with a consumable amount of information on each slide and slide design that does not distract or alienate. If I can develop my skillset to always fall within the boundaries of this concept, I believe most of my battle is won. However, this is a difficult transition for me, as I am always most interested in the underlying data and information behind a presentation and always am yearning to dive deeper into what I have been presented with and what I am presenting. Therein lies my challenge: balancing the desire for information with the desire to be understood. Tricky for sure!

I think that we have seen fantastic examples in the first two semesters of MP of how to do this correctly, so we obviously have some classmates very strong in the area of slidecraft. Personally, I have had little previous need to develop me skills with Powerpoint or similar software, but I was fortunate to work with a great team in last fall’s semester of MP, from which I was able to begin to sharpen my skills. Again, thankfully, I was paired with a team during the spring that had excellent technical slide creators from whom I gained an even more detailed look into the mechanics of creating the slides. This is where I intend to focus the balance of my semester: the technical details of actually creating the slide deck and I look forward to seeing the resources that everyone is able to uncover.