The article below focuses on the gaps between the potential for business intelligence and its current usage. Much of the gap can be explained my management’s reluctance to change- something that we have discussed thoroughly during our first year at Emory.
According to a survey they conducted among executives only 13% utilized advanced BI techniques such as predictive analytics and alerts, and about half of the respondents fill reporting needs through manual extraction of information into spreadsheets and PDFs.
There is still a significant resilience to change among executives who believe that “if it ain’t broke, don’t fix it” so companies still use analytical tools like Tableau and Microstrategy that do the job but come with a large price tag in time and manpower.
In most cases, companies don’t need real-time information, but getting daily reports (P&L, for example), can make a significant difference in your forecasting and variance analysis capabilities.
It seems that using BI is far from being a standard across industries and that early adopters are still enjoying the first-mover benefits.
As part of a MBA program, most of us are either going to be looking for a new boss soon or will be a boss to some new employees. To that point, I came across an article by Alex Malley that is helpful on how to spot (and avoid) a horrible boss. This helps us not only while we are contemplating on a new position but also the pitfalls to avoid so that we don’t become one of “them”.
Alex basically talks about 5 signs to watch out for during a job interview. They are:
1) Keep an ear to the ground: Right from your first conversation, pay attention if the interviewer is actually listening to what you have to say. If they don’t in an interview, it is likely in the job they won’t too.
2) Honest eyes: The eyes often tell a different story to the voice. When in doubt, trust the eyes. See if the eyes and what they are telling is consistent.
3) If it is “I” before “we”, reconsider working with them: A natural leader will comfortably use the word “we” when discussing the workplace. Sure they may slip in occasionally, but be cautious if it is always “I” before “we”.
4) The dominator: Look for the dominant interviewer, and observe the other staff around. Do they agree to everything they say? Are they too intimidated to bring something up? If yes, then ask yourself, is this the environment you want to work in?
5) Throw in culture question: Closely follow the response to the question and assess if it is genuine. If it is genuine you should see a positive change in the body language of the responder. This will give you a real feel on how the culture of that department is.
Developing complete certainty about any job/boss is almost impossible, but following the above tips will give us a better chance of success as well as if you are the boss, avoiding these tips will not make us “that bad boss”.
Going into grad school, one of my main goals was to change jobs and change industries. Needless to say, I knew that I had a lot to learn, both in and out of the classroom. In retrospect, I took a three-pronged approach to acquire the business intelligence that helped move me from me from point A to point B:
1) Talk to anyone and everyone who worked in the space. I mean everyone. Through networking opportunities, I was able to land some informational interviews with industry leaders that were happy to share their experiences. There is no substitute for the value of their insights that both informed me and reinforced my desire to be a part of the industry. Even more valuable – and directly responsible for my eventual success – was the help of classmates that had significant experience working for food and beverage companies (you know who you are!). Their willingness to help was undoubtedly the turning point for me, and the shared knowledge of industry dynamics and lingo was instrumental. I truly believe gaining direct knowledge from peers and mentors is the best way to gain business intelligence.
2) Industry publications: Being familiar with the current landscape of an industry is critical in making a big transition. So many resources are available to help deepen understanding and industry knowledge, and not just the usual suspects. I was able to stay on top of emerging food and beverage trends by following leaders on Twitter and other social media platforms. This awareness was integral during the interview process. However, as Ann Cullen, on of our business librarians, was quick to point out: consider the source. Industry publications can be motivated by all sorts of outside forces, so this must be considered.
3) The old fashioned way: research. In my meeting with Ann, we walked through so many examples of deep resources available to us. It’s truly amazing how much data there is out there, and it’s up to us to refine our skills on how to find it. Luckily, our business librarians are there every step of the way to support. In addition, she showed me several great methods to make the search easier. My favorite trick is to narrow a google search by using “inurl,” which can search for any keyword within a specific website. Another great tip is using the tilday symbol (~), which searches for any synonym of a key word. Using tips like these have helped me become more efficient in my research, and the mountain of information out there seems a little less daunting.
What research tips can you share? Do you agree with my three-pronged approach mentioned above? Have I forgotten any good source?
As an Engineer, I am often confronted with presentations that attempt (sometimes more successfully than others) to tell a story using data. As a rule of thumb, I generally prefer the “KIS” method – keep it simple, when presenting to any audience that is not entirely comprised of subject matter experts on the information. Additionally, overly convoluted presentations can leave even the most expert team members confused, resulting in too much time spent explaining the charts and not enough time explaining the meaning behind the charts.
In Jim Stikeleather’s article “How to Tell a Story with Data” published in the Harvard Business Review, I think he makes a few good points with which I agree. The following are a few of his points that I think we can all learn a thing or two from:
Find the compelling narrative. Along with giving an account of the facts and establishing the connections between them, don’t be boring. You are competing for the viewer’s time and attention, so make sure the narrative has a hook, momentum, or a captivating purpose. Finding the narrative structure will help you decide whether you actually have a story to tell. If you don’t, then perhaps this visualization should support exploratory data analysis (EDA) rather than convey information. However, for the designer of an exploratory visualization it is still important to spark the viewers’ imagination to encourage examining relationships among and facilitate interacting with the data – think gameification.
Think about your audience. What does the audience know about the topic? Is it meant for decision makers, general interested parties, or others? The visualization needs to be framed around the level of information the audience already has, correct and incorrect:
Novice: first exposure to the subject, but doesn’t want oversimplification
Generalist: aware of the topic, but looking for an overview understanding and major themes
Managerial: in-depth, actionable understanding of intricacies and interrelationships with access to detail
Expert: more exploration and discovery and less storytelling with great detail
Executive: only has time to glean the significance and conclusions of weighted probabilities
Be objective and offer balance. A visualization should be devoid of bias. Even if it is arguing to influence, it should be based upon what the data says–not what you want it to say. Tufte found numerous charts that misled viewers about the underlying data, and created a formula to quantify such a misleading graphic called the “Lie Factor.” The Lie Factor is equivalent to the size of the effect shown in the graphic, divided by the size of the effect in the data. Sometimes it is unintentional-a number that is three times bigger than another will be perceived nine times bigger if represented in 3D. There are simple ways to encourage objectivity: labeling to avoid ambiguity, have graphic dimensions match data dimensions, using standardized units, and keeping design elements from compromising the data. Balance can come from alternative representations (multiple clustering’s; confidence intervals instead of lines; changing timelines; alternative color palettes and assignments; variable scaling) of the data in the same visualization. Maintaining objectivity and balance is not a trivial effort and is easily unintentionally violated. Viewers and decision makers will eventually sniff out inconsistencies which in turn will cause the designer to lose trust and credibility, no matter how good the story.
Finally, Edit, Edit, Edit. Also, take care to really try to explain the data, not just decorate it. Don’t fall into “it looks cool” trap, when it might not be the best way explain the data. As journalists and writers know, if you are spending more time editing and improving your visualization than creating it, you are probably doing something right.
Bain & Company published an article, “How Organizations Make Great Decisions” by Michael Mankins and Jenny Davis-Peccoud. Mankins and Davis-Peccoud claim that organizations whose decisions fail are due to dysfunctional processes.
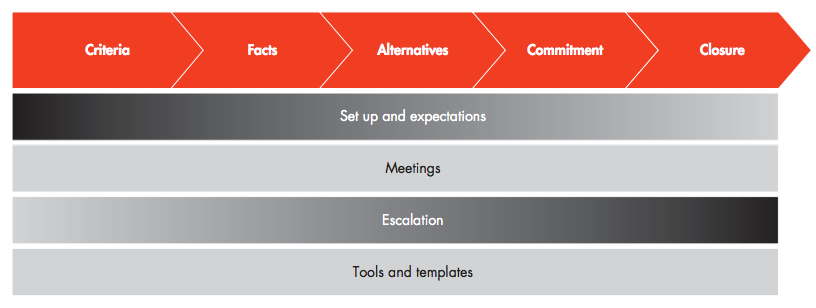
Through their experience, they found that firms which established a “structured approach to decisions, one that ensures agreement on criteria, facts, alternatives, commitment and closure” are successful in making great decisions. These companies not only have high-quality decisions and execution but their enablers allow the decision process to move smoothly and quickly.
Every company’s structured decision approach is going to differ based on company culture and governance but they should include five critical elements: criteria, facts, alternatives, commitment and closure.
The five critical elements of structured decision making and the enablers that support them
Criteria: Know the goal of your decision and clarify the criteria for making the decision. For example, if the firm wants to give an end-of-month discount offer for customers, the goal will be to increase end-of-month sales by 15%. The criteria tells us whether the decision to offer a discount was effective.
Facts: Find the precise facts you need to understand the scenario, create alternatives and come to your decision. If the facts directly relate to the decision making criteria, you can use the data, there is not a need to find all data available.
Alternatives: Evaluating alternatives improves the quality of decision making. Ask the recommender, “What alternatives did you consider and reject and why?”
Commitment: The group must commit to the decision. Hopefully everyone agrees on it as well, but once the decision is made, all parties must support the decision for it to succeed.
Closure: Making the decision and committing to it is only the first step. Without communication of the decision, taking responsibility for execution, setting timelines for Implementation, and creating a feedback loop to monitor the performance of the Implementation, the decision will not happen.
The last element spoke to me the most. Often decisions at my company are made that are not properly implemented. The decisions are executed poorly and never reach their intended effect. Or the decision fades away and is never implemented.
In my opinion, the last element could be the most time consuming part of the decision making process. It is imperative for management to work through the challenges facing the implementation, monitoring the feedback loop for the decision’s progress. If the decision is not achieving its desired result, management must act quickly to adjust the implementation.
Mankins and Davis-Peccoud identified four ways that companies can enable great decisions:
Take the time to plan, prepare and implement the decision
Do not try to accomplish everything in one meeting
Discuss operating reviews and strategy conversations separately
Discuss facts, alternatives, and make the decision in separate meetings
Only escalate if necessary and have guidelines to know when decision making escalation is necessary
Use company created tools and templates for many, if not all, strategic decisions
My main take-away from the four enablers is to not use one meeting to accomplish all steps of the decision making process. For a large decision that affects many people, it is better to focus on each step of the decision making process separately. At first this sounds like too many meetings to come to a decision. However, if Mankins and Davis-Peccoud are correct, setting a meeting for each stage of the decision making process will keep the process moving and allow management to consider the facts, alternatives, make the right decision, and set the implementation plan.
My department is currently considering changing how we approach software implementations. We want to be seen more as marketing consultants than software trainers. I am going to take this decision making approach to my team and ask that we use this process as we go through changing our implementation strategy.
The main ingredients of building an effective team are:
Defined Goals & Roles
Decision Making
Commitment
Good Leadership
Communication
Organization
Collaboration
Competence
Respect
Passion
From our past two semesters, I have learned that in order for a team to succeed we need all these ingredients. You don’t have to be an extraordinary personality to have the skills you need to build and lead high performing team. People must work closely together, wear many hats and work effectively across the organization to get tasks accomplished quickly enough to remain competitive.
There is an article I read, which very well explains the characteristics of an effective team, such as:
An effective team understands the big picture
An effective team has common goals
An effective team works collaboratively, as a unit
When I got my first job as a Process Improvement Engineer for an industry leading company in their flagship facility, my first question to their production manager was: “Where’s the historical data on the process we need to improve?”. His answer was: “Well I know how many pounds of potatoes we usually put in, and I know about how many bags of potato chips come out the other end.”
How could such a sophisticated, industry leading company have so little knowledge about their own processes? Four years later, reflecting back on all the companies I have worked for and had exposure to, few have had the ‘big data’ that is such a popular topic of today’s data analysis discussions.
How do those us us who have only, ‘Tiny Data’ or incomplete data use it to make better decisions and improve out businesses? The first article posted below cites an Army Colonel’s experience:
“Look,” said the colonel, “if I’m on a battlefield trying to defend a hill and I get a piece of intelligence, even if I’m not 100 percent sure that it’s accurate, I will make decisions based on that intelligence.” He strongly believed that it’s better to have some information than none—and that you’d be a fool to disregard it just because it falls short of being definitive.
There are many ways to utilize small amounts of data, incomplete data, and varying quality data. You must find ways to fill in the gaps, determine the variance of the quality, and find ways to draw meaningful conclusions and areas to investigate more fully with small amounts of data.
Branch out and be creative, because a little bit of information is better than no information and is no excuse for simply accepting the status quo.
It was so interesting to see that the blog post “Stages of Skill Acquisition” from 7/1/14 referenced the Dreyfus Model for skill development. In coming up with guidelines for MBAs in MP to determine their own personal development of business intelligence skills, we put together a five level framework based on the model developed by Dreyfus and Dreyfus. This was shared with everyone as part of the Business Intelligence workshop training you received last winter. The attached Business Intelligence Brief provides more details on this framework that you can use to track where you are in the attainment of specific business information gathering skills.
We often have to work with people in different cities in my business, and sometimes even different time zones! It can be a huge challenge to coordinate work with people you usually don’t see on a day to day basis. It seems like more and more companies are moving to teleworking, so I thought it would be good to go over some key tips on managing a virtual team:
1) Organize regular meetings with individuals as well as the team as a whole.
This doesn’t have to be in-person; a phone call or Skype can be just as effective. The main thing is you want to make sure everyone is on the same page. The team needs to feel cohesive and like they are all “in the loop” on what’s happening. We do daily “show calls” with all of our team members in Abu Dhabi, London and here in Atlanta. While this may not be feasible for every team, even a set weekly/monthly phone call can be good to foster communication and a sense of inclusiveness. A phone meeting is also a good way to address any team problems out in the open.
2) Rotate locations: Try to make sure members spend some time physically with the team in their home base, even if all members can’t all be there at once.
This is a critical part of getting a team to work together effectively. Once you put a face with that voice on the phone, you form a personal connection with that person. It’s also good to see how people function differently while working in the same room. This gives you the opportunity to confront any workflow or personnel issues. This would also be a good time to help the team bond through a social activity, games, etc.
3) Recognize cultural sensitivity. Be aware of cultural differences on your team so you can head off any potential issues.
I work with people from a variety of backgrounds and walks of life. It is so important to be aware that people often have very different styles of communication and management. A good way to head off issues is to make the team aware of the expectations for communication and conflict resolution. For example, a manager could instruct team members to mediate conflict themselves, before rushing to upper management to handle the situation. Team building exercises and cultural awareness classes could also help.
The biggest takeaway I got from this article is the importance of having good communication! It’s not easy managing a team flung across different cities or countries. But the team will work a lot more smoothly if everyone is kept in the loop, and any problems are dealt with quickly and transparently.
Well maybe not Hell if you take the advice of Nicole Fallon of Business New Daily and recognize that the greatest business plans likely don’t stand a chance without an equally strong elevator pitch. So how do you go about knocking one of those impassioned two-minute diatribes out of the park? Below is a sampling from Nicole’s article, “10 Tips for a Winning Elevator Pitch” from this past February.
1. Start Strong: “Eighty percent of your success will depend your opening line. It must snag your listener’s interest and make them want to know more. Do this right, and your prospects will follow you, wanting more.” – Bert Martinez , Bert Martinez Communications
2. Prioritize: “While creating interest and value is key, remember to be authentic and realistic. Making outlandish claims about your company will eventually be discovered, and your integrity will be diminished.” – Ed Cederquist, CEO and co-founder of Bistro MD
3. Keep it conversational: “You want to stand out and generate excitement. Don’t regurgitate a memorized pitch that sounds like a pharmaceutical ad. When I hear a pitch, I don’t necessarily want to feel like I am being pitched. I would rather have it be more conversational. Start with the problem you are trying to solve, the way the current alternatives are lacking; then, briefly describe your solution.” – John Torrens, assistant professor of entrepreneurial practice at Syracuse University’s Whitman School of Management
4. Think about your end goal: “You should build your exit strategy along with your business plan. Investors want to know that you’ve evaluated the risk and thought your plan through from soup to nuts” – Summer Kramer, founder of SummerSkin
5. Make a connection: “An elevator speech is an important networking tool. It should serve as a verbal business card that provides a brief, compelling introduction to one’s company and intrigues new acquaintances to seek more information. At your earliest opportunity [after giving your pitch], express an interest in your new acquaintance and learn as much as you can about him or her. The information you gain will provide insight as you proceed with efforts to build a genuine, mutually beneficial relationship.” – Juana Hart, founder of J-Hart Communications